
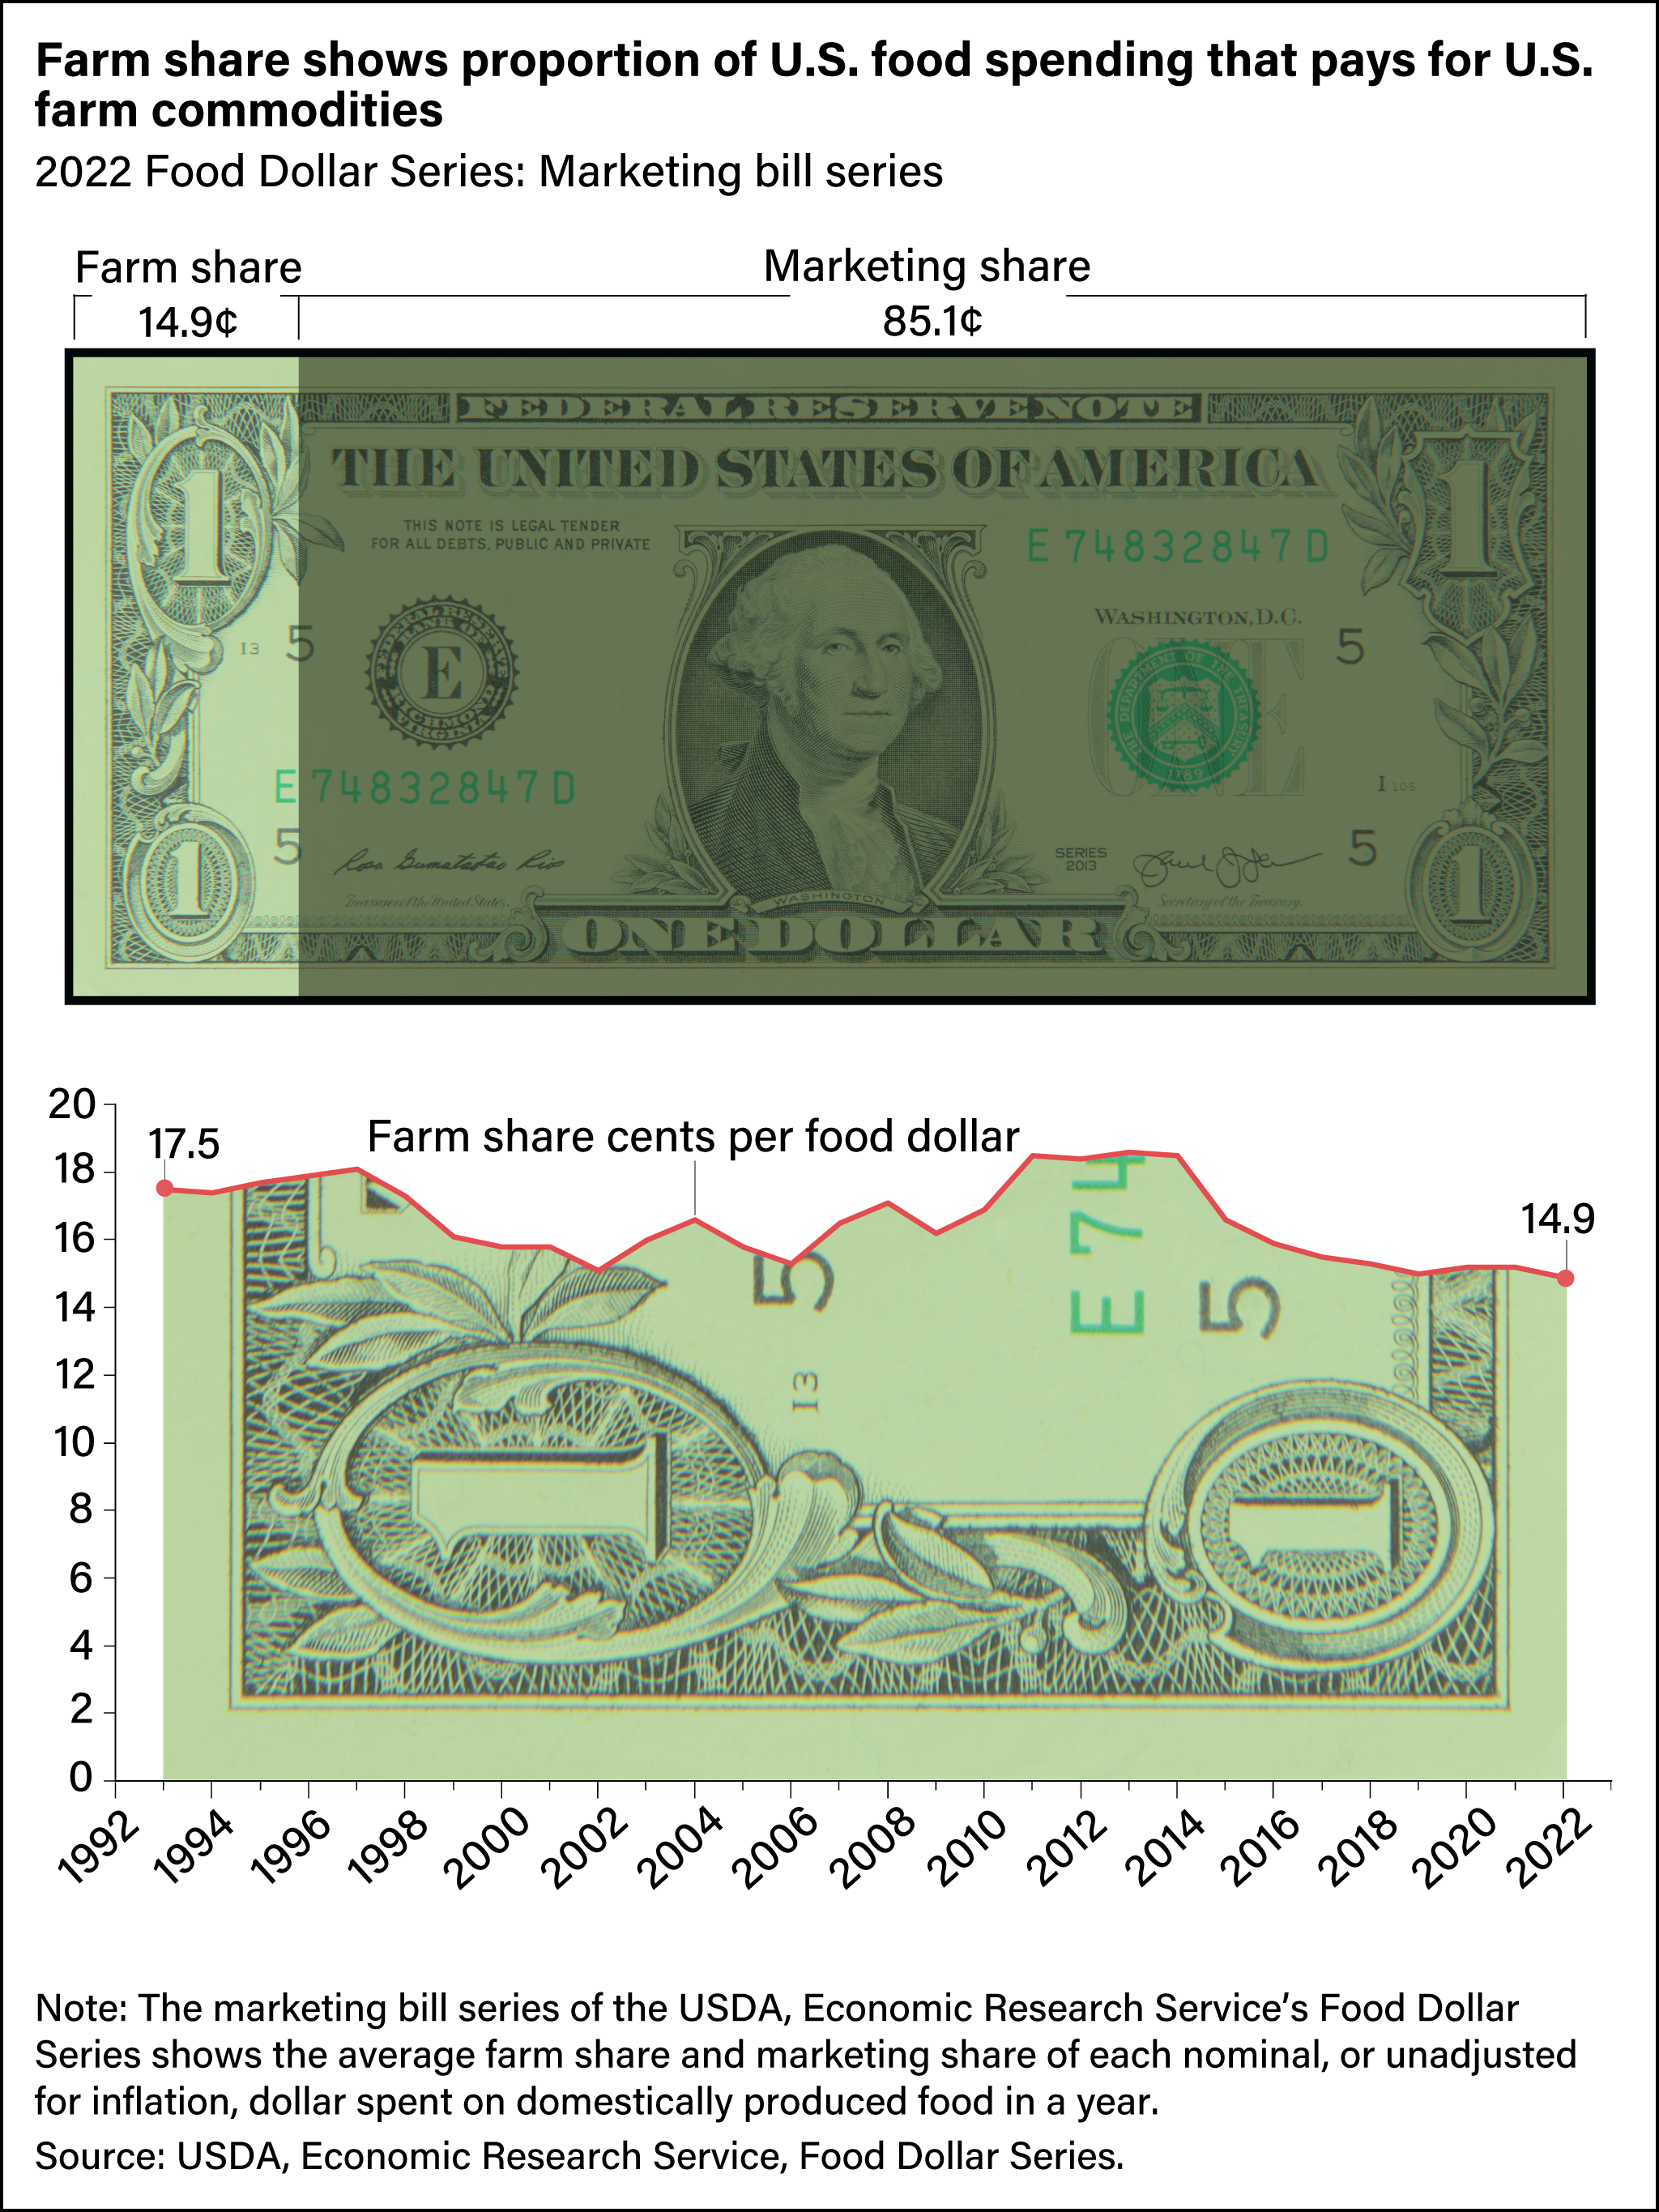
Farm share shows proportion of U.S. spending that pays for U.S. farm commodities
- by Quinton Baker and James Chandler Zachary
- 12/21/2023
Using three different models of the same food supply chain, the USDA, Economic Research Service’s Food Dollar Series breaks down the distribution of a representative $1 of annual consumer food expenditures on purchases for eating at home and away from home.