
Balance of refined and whole grain consumption has narrowed only slightly since 2005 Federal recommendations
- by Joanne Guthrie, Biing-Hwan Lin and Travis A. Smith
- 9/14/2023
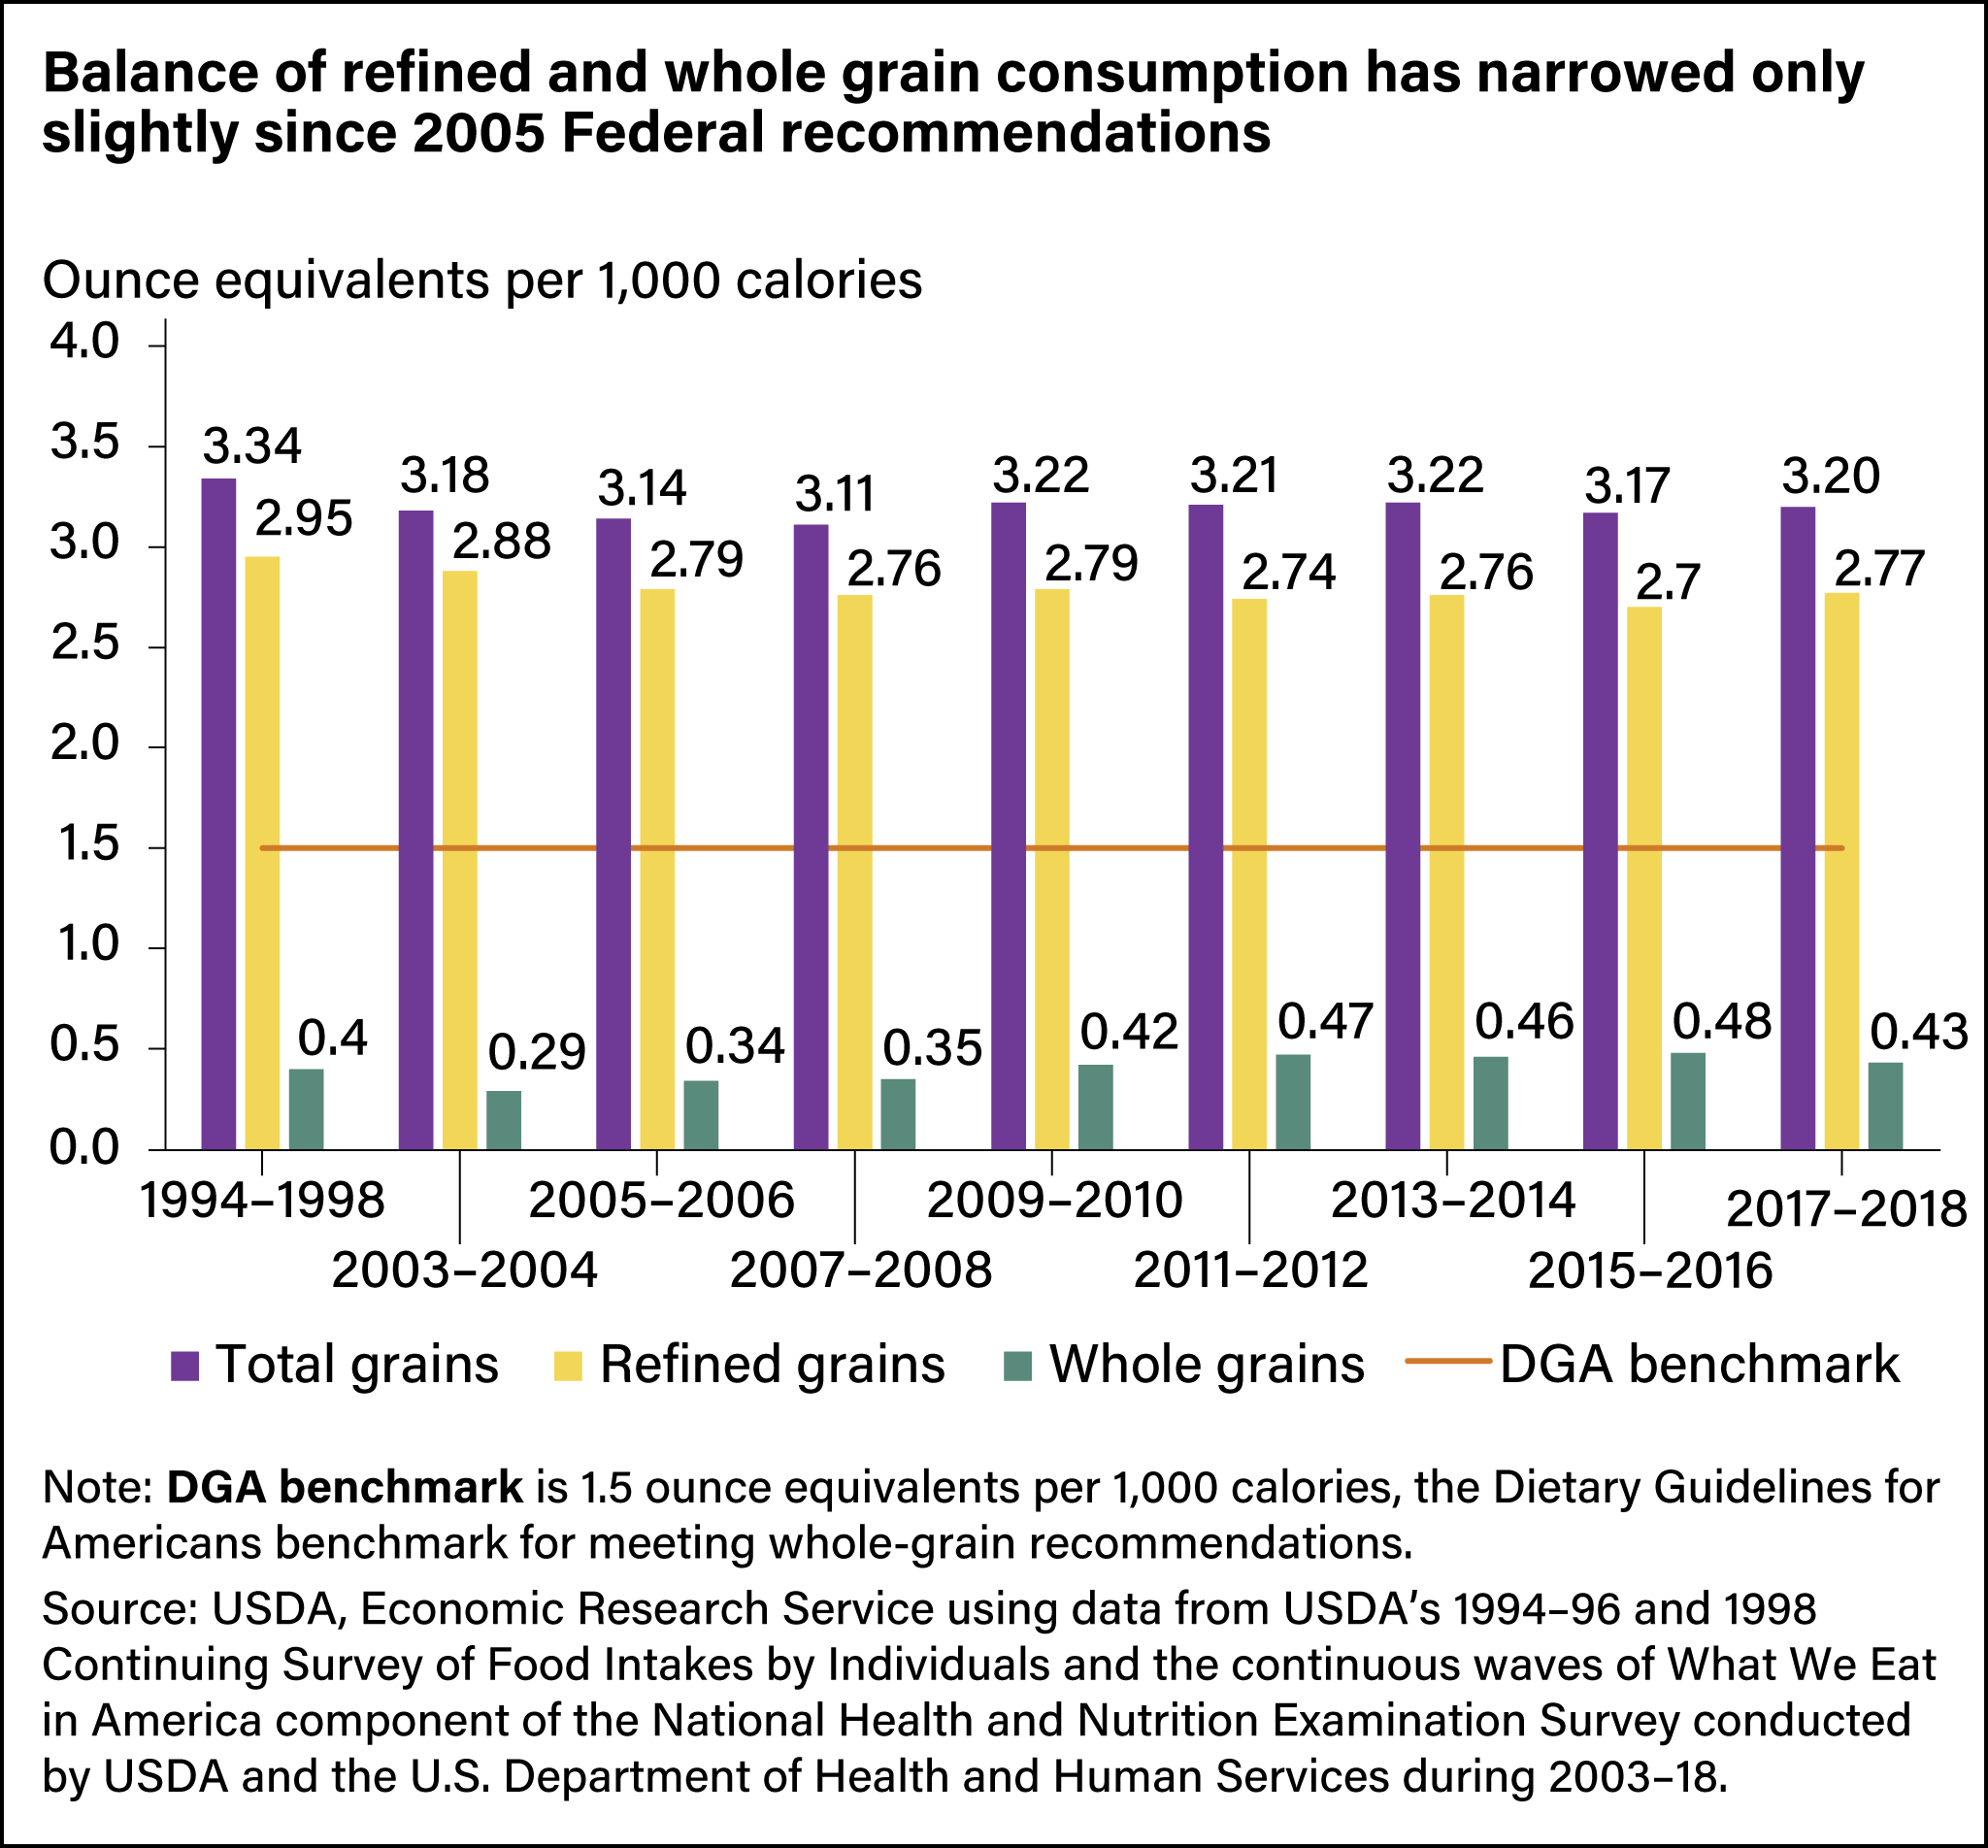
Whole-grain intakes in 2017-2018 remained far below that of refined grains despite 2005 Federal recommendations that half of grains consumed be whole grains. Beginning 2013–14, children’s diets were significantly more whole-grain dense than before, following 2012 requirement that USDA school meals include whole grains.