
Food-at-home costs are distributed among industries along the food supply chain
- by Megan Sweitzer
- 7/10/2023
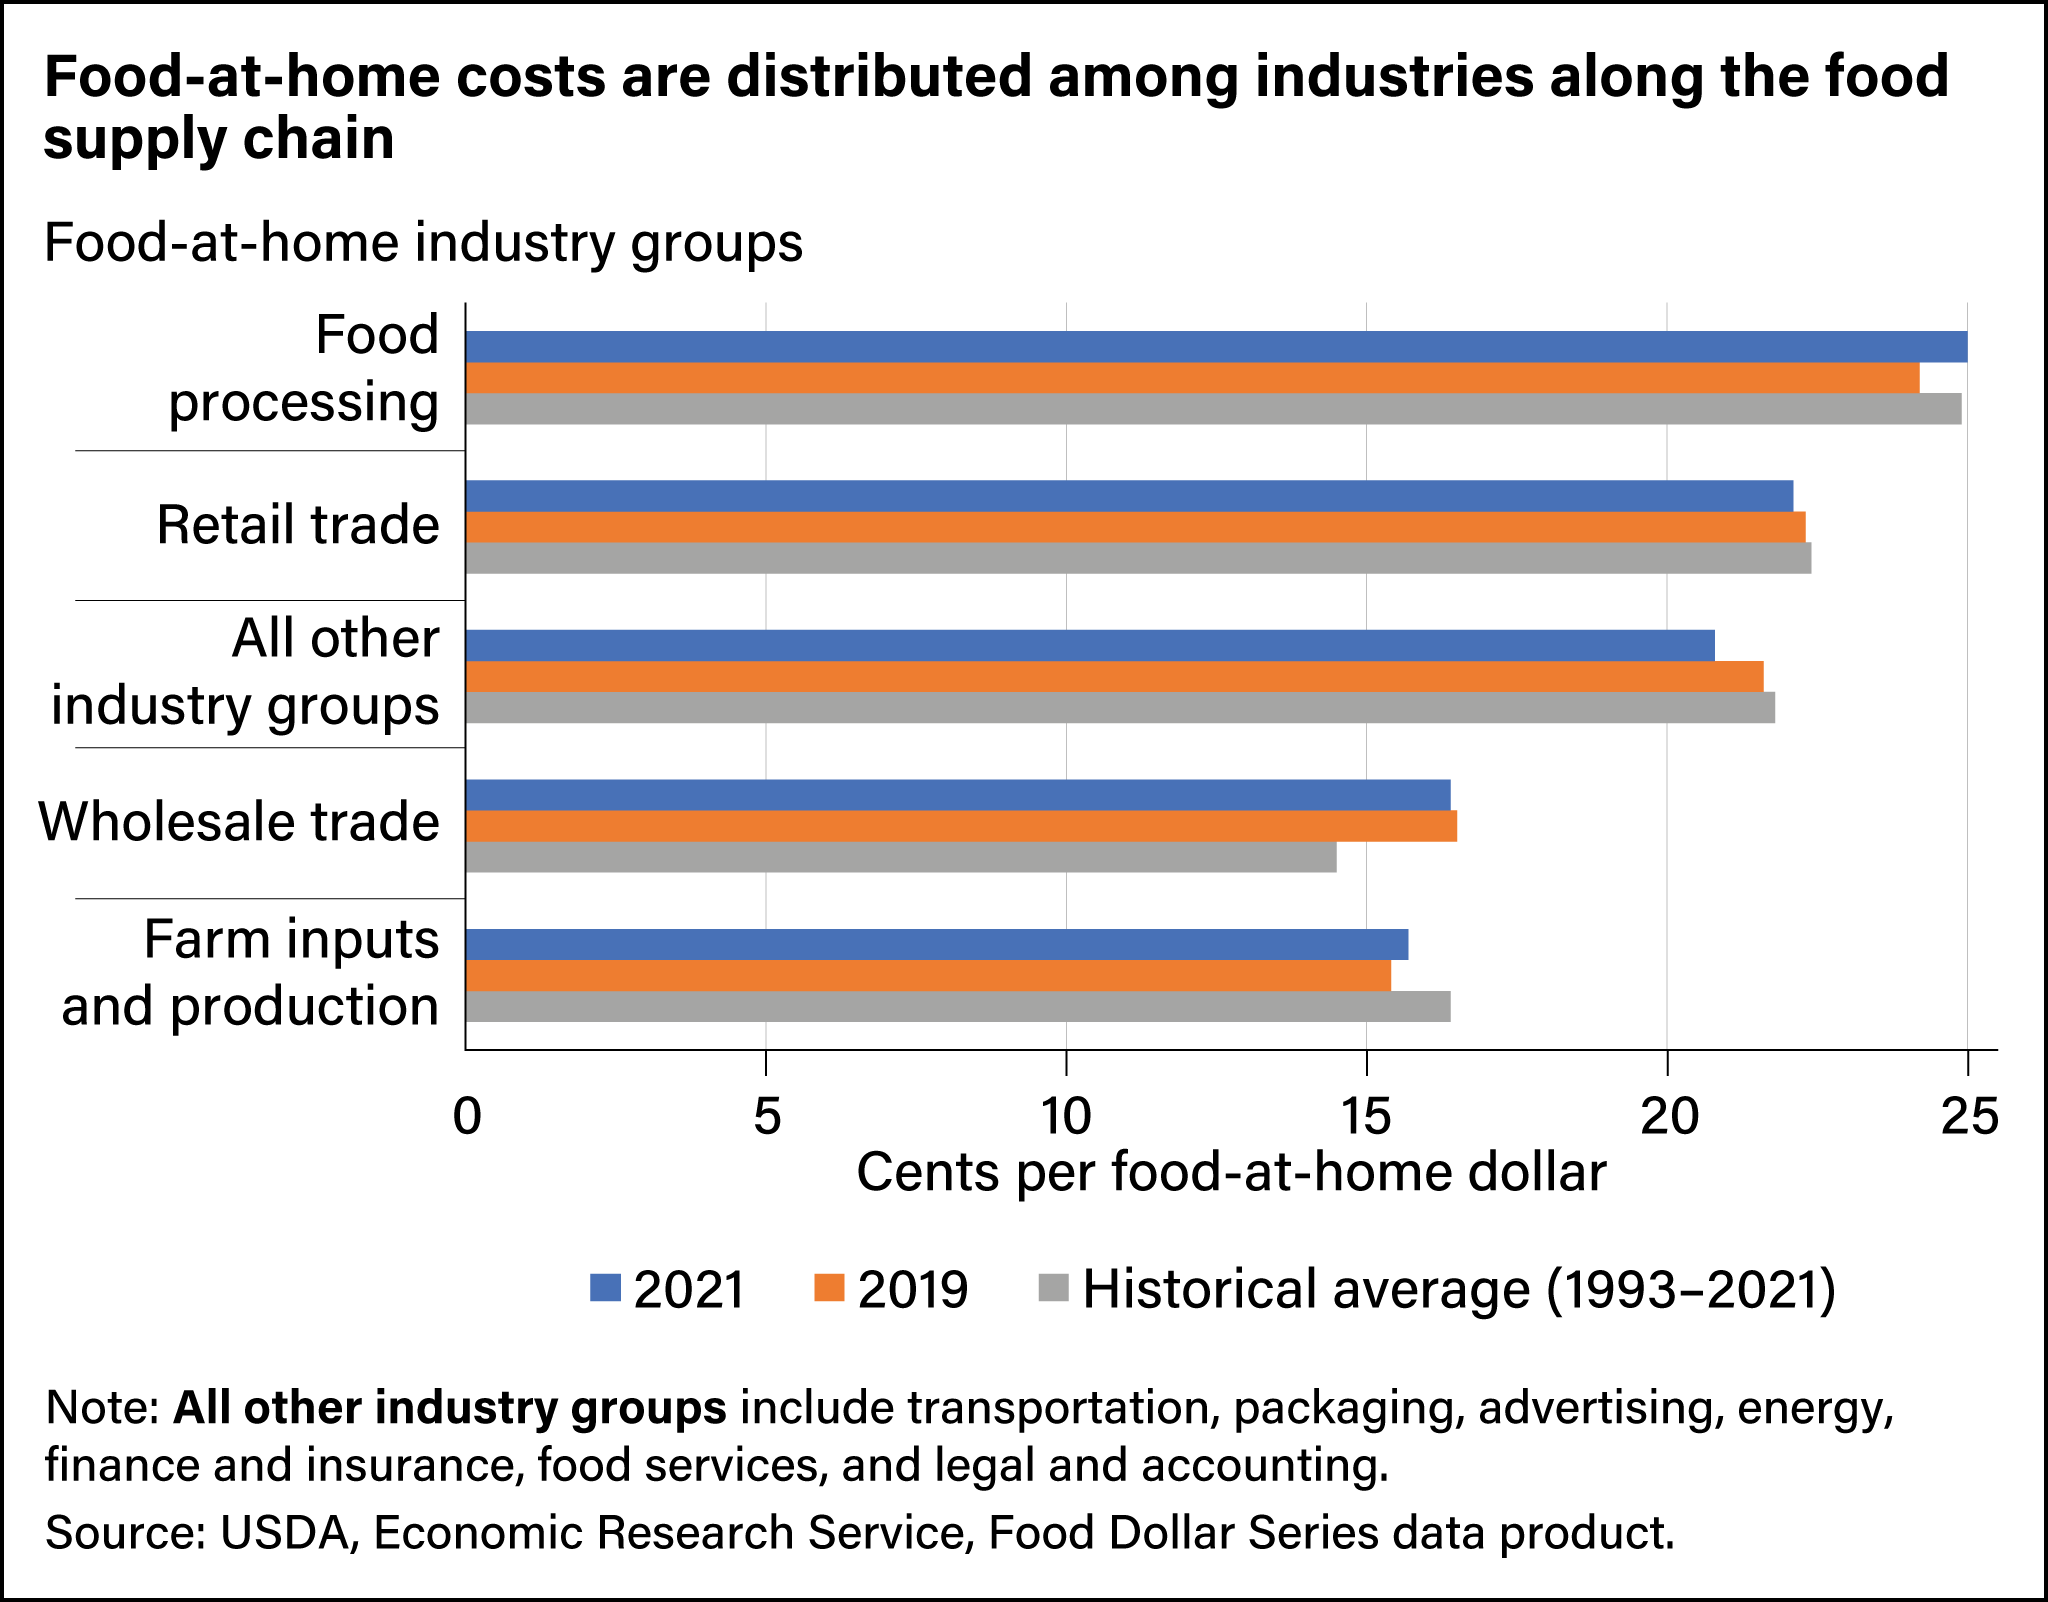
Horizontal bar chart showing share of food-at-home dollar spent on food processing, retail trade, all other industry groups, wholesale trade, and farm inputs and production in 2021 and 2019, and the 1993–2021 average.