
Lower commodity prices after 2012 contributed to higher bankruptcy rates in some States
- by Nigel Key, Jonathan Law and Christine Whitt
- 11/30/2021
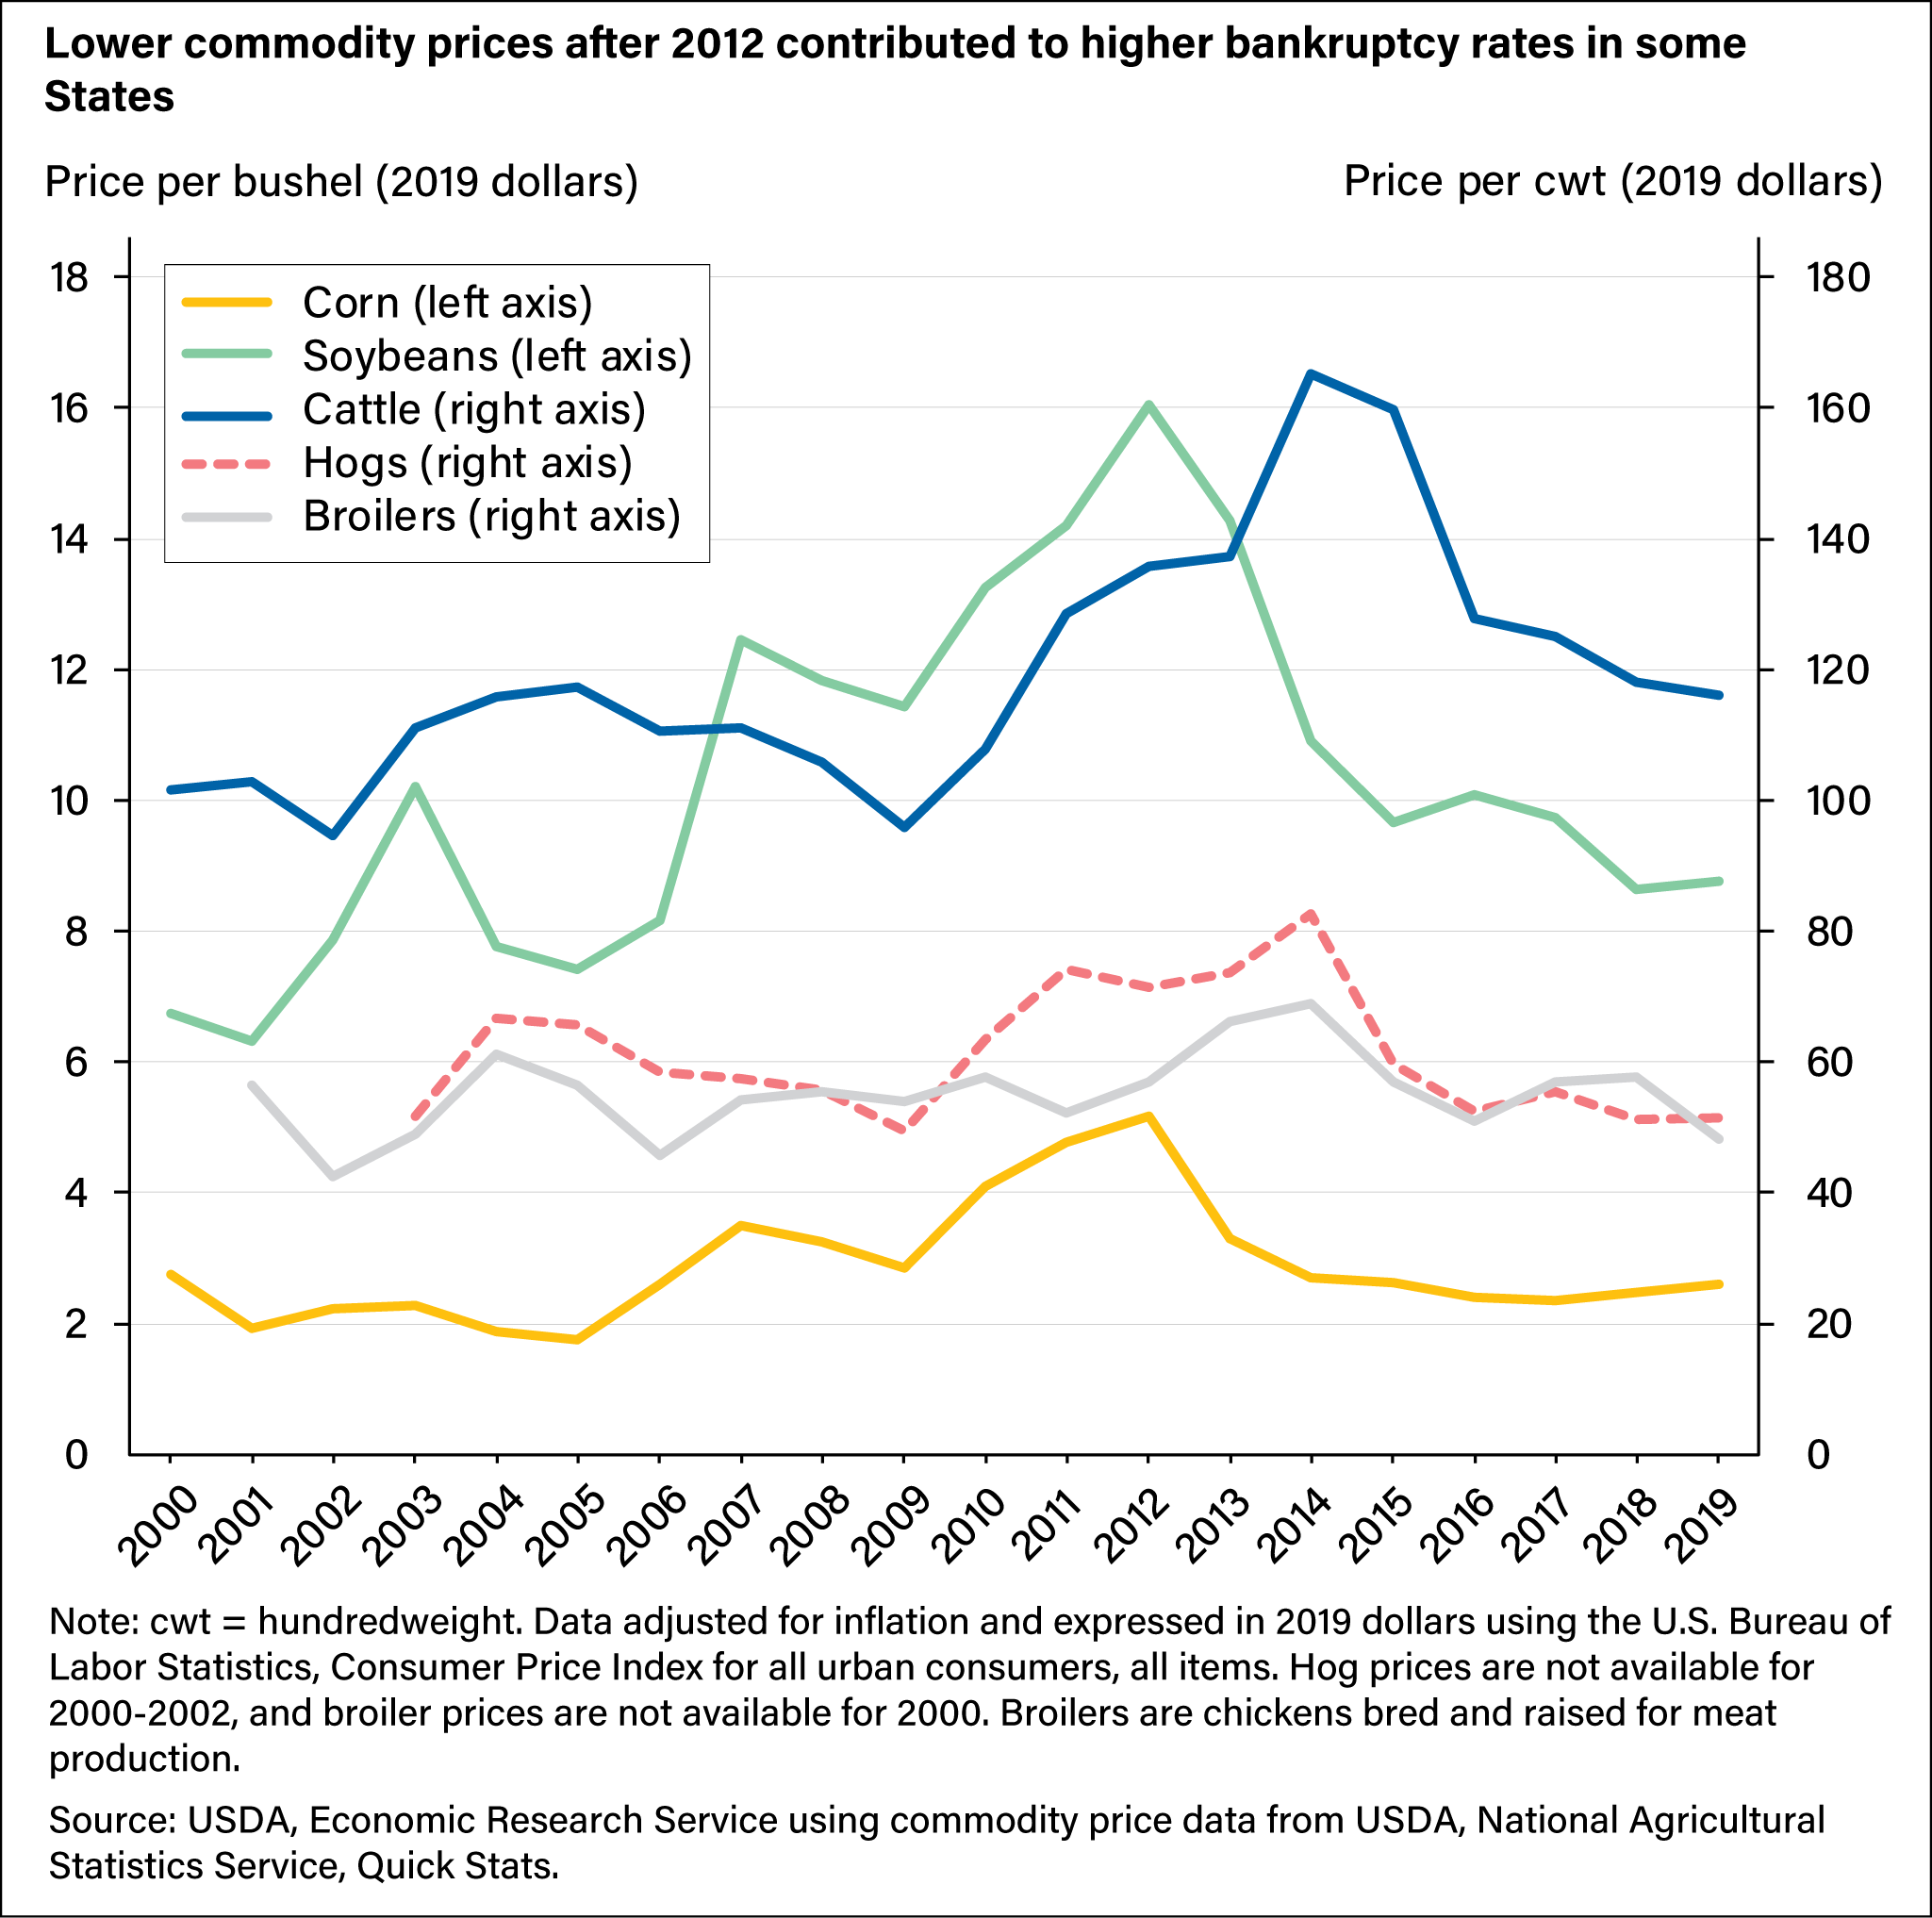
This is a line chart showing the price per bushel in 2019 dollars for corn and soybeans and the price per hundredweight for cattle, hogs, and broilers.