
Inflation-driven change in costs of U.S. foodborne illnesses varied substantially across pathogens, 2013-18
- by Sandra Hoffmann and Jae-Wan Ahn
- 3/19/2021
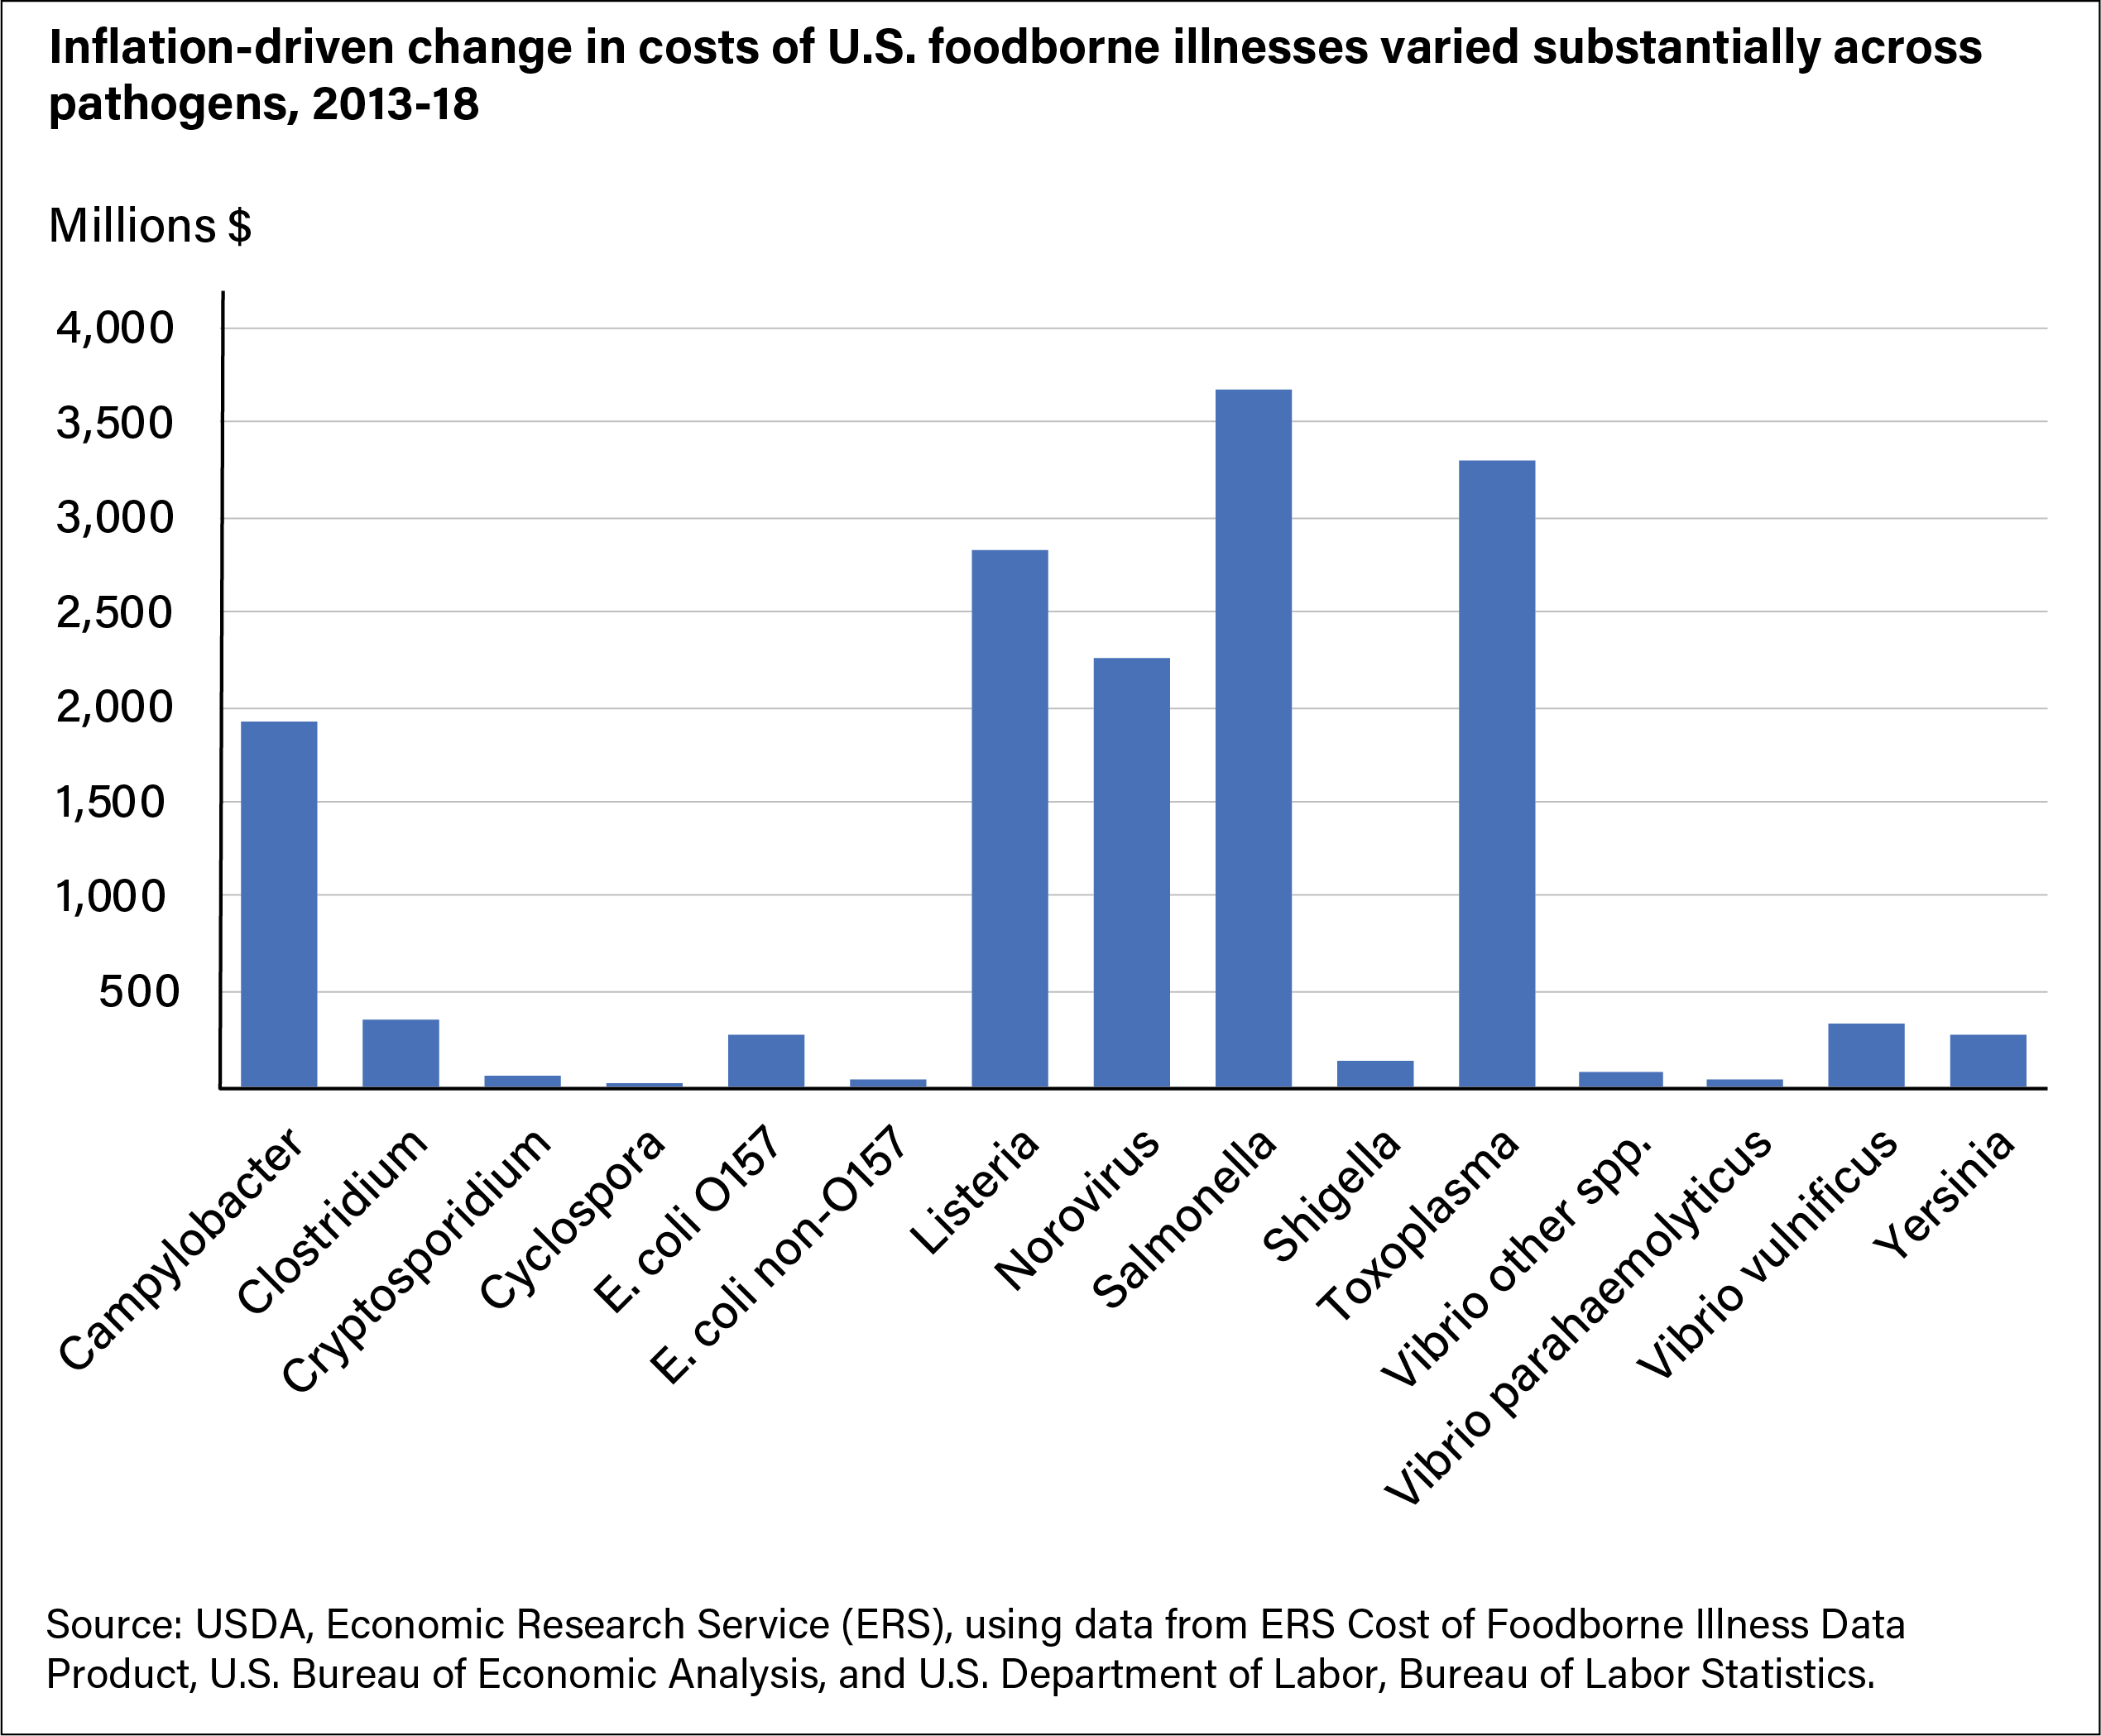
Bar chart showing the inflation-driven changes in costs of U.S. foodborne illnesses in millions of dollars by 15 pathogens from 2013 to 2018.