

Agricultural Productivity Growth in the United States: 1948-2015
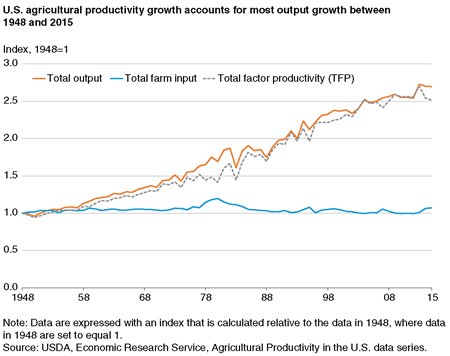
Technological developments in agriculture have been influential in driving long-term growth in U.S. agricultural productivity. Innovations in animal and crop genetics, chemicals, equipment, and farm organization have enabled continuing output growth while using much less labor and farmland. As a result, total agricultural output nearly tripled between 1948 and 2015—even as the amount of labor and land (two major inputs) used in farming declined by about 75 percent and 24 percent, respectively.
Productivity can be measured in different ways, such as by yield (production per unit of land—a single-factor measure). For instance, between 1948 and 2015, the average soybean yield doubled from about 21 to 48 bushels per acre. The average corn yield grew much more, from 43 to 168 bushels per acre. However, a single-factor productivity measure like yield is sensitive to changes in the use of other inputs and does not necessarily reflect overall technological advancement. For example, crop yields could increase as more fertilizer and pesticides are used, even if there were no improvements in production techniques.
On the other hand, total factor productivity (TFP) takes into account the contributions of all inputs, including capital, land, labor, and intermediate inputs such as agricultural chemicals and energy. Annual TFP growth is the difference between the growth of all agricultural outputs and all inputs taken together. Therefore, TFP can provide a more informative measure of overall agricultural productivity over time.
According to the newest ERS data, U.S. farm output grew by 170 percent between 1948 and 2015—at an average annual rate of 1.48 percent. With total input use rising only 7 percent over the same period, productivity growth accounted for most of total output growth during that period. TFP grew at an average annual rate of 1.38 percent, compared to 0.1 percent for total inputs.
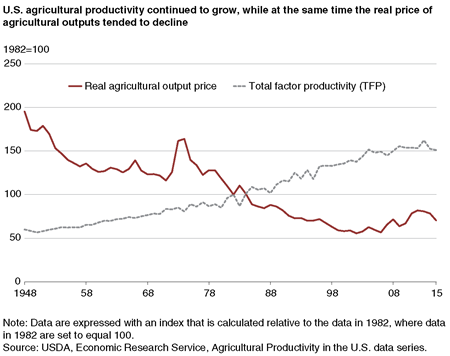
Productivity growth in the U.S. farm sector has implications for both U.S. and global food markets. The United States is one of the largest consumers and producers in world agricultural commodity markets. Slowing productivity growth that fails to keep pace with increasing food demand may lead to rising food prices. It may also put pressure on low-income households as they spend a greater share of their income on food. While in the short term, transitory events—such as energy shocks or supply shortages due to bad weather—may cause agricultural commodity prices to rise, the long-term growth trend in U.S. agricultural productivity has enhanced food security and benefited consumers by reducing the real (inflation-adjusted) price of agricultural outputs over time.
While total inputs have grown little, their composition has shifted considerably toward more use of farm machinery (part of capital goods) and intermediate inputs—and less use of labor and land. Between 1948 and 2015, labor inputs declined by 75 percent and land inputs fell by 24 percent. By comparison, intermediate and capital inputs (excluding land) grew by 134 percent and 78 percent, respectively. This offset the negative impacts from reductions of labor and land, allowing the overall contribution of input growth to output growth to remain slightly positive.
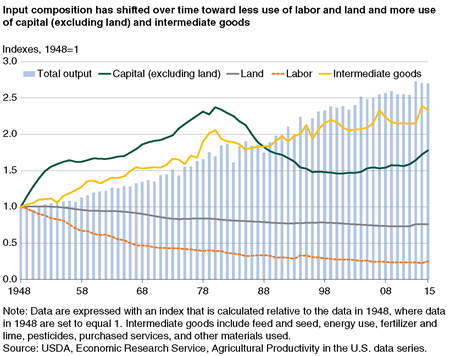
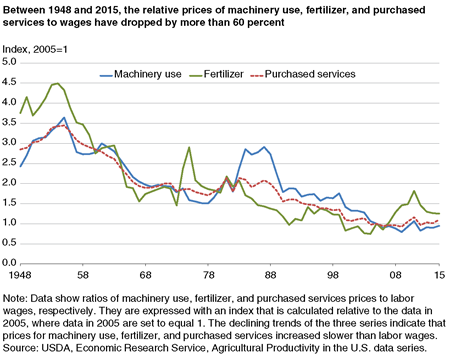
Many factors contributed to these input changes. For example, competing uses for labor and land from other sectors or purposes have raised the costs of those inputs. Technological advancements have also made inputs like machinery and agricultural chemicals more affordable for farmers. Over time, the prices of machinery, fertilizer, and purchased services have declined relative to wages.
ERS also reports measures of average annual TFP growth rates in subperiods defined by business cycles (measured from peak to peak in accordance with fluctuations in the overall U.S. economy), as well as sources of agricultural output growth. In recent subperiods, the contribution of total input growth to output growth has risen, as the decline in labor use slowed and total capital inputs (including land) rose. During the most recent 2007-15 subperiod, annual input growth accounted for nearly 30 percent of output growth on average. Annual TFP growth, on the other hand, accounted for about 70 percent of output growth, down from nearly 90 percent during 2000-2007. The average annual TFP growth rate also dropped to 0.53 percent during 2007-15, down from 0.92 percent during 2000-2007. Nevertheless, TFP growth is still the major source of output growth.
| 1948-2015 | 1981-1990 | 1990-2000 | 2000-2007 | 2007-15 | |
|---|---|---|---|---|---|
| Output growth | 1.48 | 0.79 | 1.79 | 1.03 | 0.72 |
| Sources of growth | |||||
| Input growth | 0.10 | -1.32 | 0.24 | 0.11 | 0.20 |
| Labor | -0.46 | -0.45 | -0.23 | -0.38 | 0.00 |
| Capital | -0.04 | -0.78 | -0.17 | -0.12 | 0.24 |
| Intermediate goods | 0.60 | -0.09 | 0.64 | 0.60 | -0.04 |
| TFP growth | 1.38 | 2.11 | 1.55 | 0.92 | 0.53 |
| Sources decomposition | |||||
| Labor: Hours | -0.57 | -0.52 | -0.41 | -0.40 | -0.08 |
| Labor: Quality | 0.12 | 0.07 | 0.18 | 0.02 | 0.08 |
| Capital: Stocks | 0.03 | -0.75 | -0.25 | 0.00 | 0.29 |
| Capital: Quality | -0.07 | -0.03 | 0.08 | -0.12 | -0.06 |
| Intermediate goods: Quantity | 0.64 | -0.02 | 0.61 | 0.63 | 0.15 |
| Intermediate goods: Quality | -0.04 | -0.07 | 0.03 | -0.03 | -0.19 |
| Note: TFP = total factor productivity. The subperiods are measured from cyclical peak to peak in aggregate economic activity. Intermediate goods include feed and seed, energy use, fertilizer and lime, pesticides, purchased services, and other materials use. Source: USDA, Economic Research Service, Agricultural Productivity in the U.S. data series. | |||||
Short-term TFP growth estimates can be affected by transitory events such as adverse weather. However, successive periods of declines in productivity growth have raised the possibility of a longer term slowdown. Investments in public and private agricultural research are the major drivers of technical change that leads to long-term productivity growth. U.S. public research funding has been stagnant since the 1980s and began to decline in real (inflation-adjusted) terms in 2009. According to economic studies, a continuing decline in public agricultural research funding may result in slowing productivity growth in the long run. Even if public research investment increases again, it would take time for TFP growth to catch up due to the long lag between research investment and technology adoption on the farm.
Agricultural Productivity in the U.S., by Sun Ling Wang, Eric Njuki, Richard Nehring, and Roberto Mosheim, USDA, Economic Research Service, January 2024
Agricultural Productivity Growth in the United States: Measurement, Trends, and Drivers, by Sun Ling Wang, Paul Heisey, David Schimmelpfennig, and Eldon Ball, USDA, Economic Research Service, July 2015