

Investigating Retail Price Premiums for Organic Foods
Highlights:
-
In 2010, retail price premiums for 17 organic foods ranged from 7 percent above the nonorganic price for spinach to 82 percent for eggs.
-
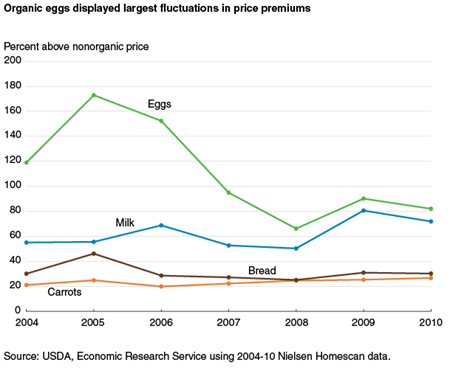
Between 2004 and 2010, price premiums fluctuated for 11 of the 17 organic foods analyzed.
-
The top selling organic products among the 17 foods were spinach, granola, strained baby food, and carrots.
Since USDA began regulating organic labels on food in 2002, the organic food sector has been one of the fastest growing sectors in the food industry. According to the National Business Journal, total sales for organic food were just under $11.5 billion in 2004, climbing to an estimated $37 billion in 2015. Organic food sales even grew during the Great Recession, as organic products became available in more retail outlets, and growth has continued since. The Organic Trade Association reports that from 2011 to 2012, organic food sales grew 10.2 percent versus 3.7 percent for all food sales, and that organic sales were up 11.3 percent from 2013 to 2014.
ERS research in 2005-06 found that organic premiums ranged from about 15 percent for onions and carrots to about 109 percent for skim milk. A 2010 study by the Hartman Group, a private marketing consulting company, reported that consumers believed that the price gap between organic and nonorganic foods was getting smaller. The same study claimed that many consumers were unwilling to pay a premium of more than 30 percent for organic food.
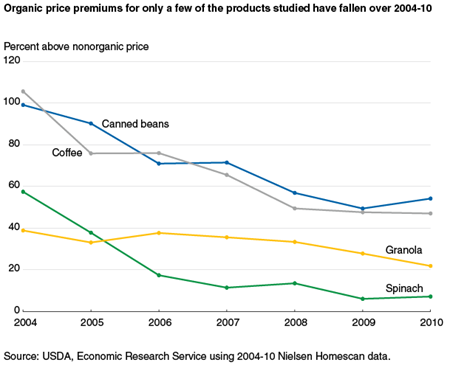
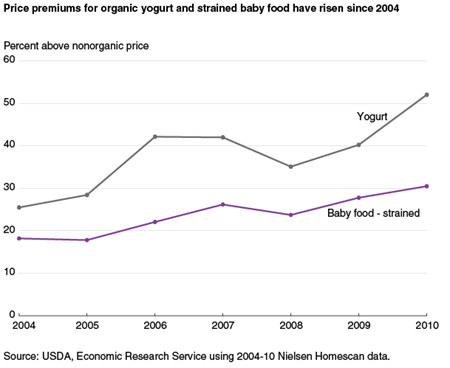
A recent ERS study set out to determine what price premiums consumers are paying for organic foods and whether those premiums are declining over time. In estimating the retail price difference between 17 organic products and their nonorganic counterparts from 2004 to 2010, the researchers found that all organic products were more costly than their nonorganic counterparts and that the premium was above 20 percent for all but spinach. Most premiums did not steadily increase or decrease during the 7 years studied, but fluctuated. Of the 17 products examined, only 4—spinach, canned beans, granola, and coffee—saw premiums generally decline. Only strained baby food’s and yogurt’s price premiums generally increased. Product-specific supply and demand factors help explain some of the differences among the estimated organic price premiums for the 17 products.
What Is Organic?
According to USDA’s National Organic Program, foods and other agricultural products that are labeled organic in the United States must be produced and handled “through approved methods that integrate cultural, biological, and mechanical practices that foster cycling of resources, promote ecological balance, and conserve biodiversity. Synthetic fertilizers, sewage sludge, irradiation, and genetic engineering may not be used.”
To maintain the integrity of the organic label, the National Organic Program regulates all organic crops, livestock, and agricultural products. Farmers, ranchers, handlers (companies or individuals who take financial control of the product from the farmers), and food processors must maintain a current organic certificate through a USDA-accredited third party, also known as a certifier. Producers, handlers, and food processors must keep accurate records verifying that they used only approved organic methods, including the use of organic ingredients in processed food. Producers and handlers must take steps to ensure that organic products are not comingled with nonorganic ingredients (including ensuring that the transportation services they employ do not allow comingling) or contaminated with prohibited substances.
Certifiers inspect all organic operations at least once each year to verify that all USDA organic regulations are being followed in the growing/raising, transporting, storing, and processing of organic products. In addition, USDA conducts audits and investigations using both monitoring and enforcement to ensure that all products labeled organic meet the USDA organic regulations.
Calculating Organic Premiums Requires Identifying Comparable Products
Bringing organic products to grocery shelves incurs additional costs—from farmers and ranchers who must follow organic rules, to handlers and food processors who must sequester organic and nonorganic ingredients, and to retailers who must allocate shelf space to organic foods and prevent comingling of unpackaged organic and nonorganic products. Many consumers are willing to pay more for organic foods, but estimating how much more they are actually paying for organic options can be challenging because of comparability issues. For example, packaged carrots can be purchased with or without the tops, in different package sizes, as baby carrots, or prechopped. Comparing the difference in price between an organic product and a nonorganic product in the same broad product category would be misleading. The organic product may be more expensive simply because it has additional processing or a trait/flavor desired by the consumer. The researchers used a statistical model to isolate the part of each product’s price that relates to the organic characteristic versus some other characteristic or trait desired by the consumer.
The researchers calculated organic price premiums using all products in the broad category but accounted for differences in product form and other marketing conditions. They defined the organic price premium as the difference between the organic price and the nonorganic price when all other product characteristics and other factors—such as the type of store where purchased, month of the year, and geographic location—are the same.
Nielsen Homescan data offer the details needed for such a nuanced comparison. Participating households in the nationally representative panel use a handheld scanner to enter each of their food purchases when purchased (see box “The Nielsen Homescan Data”). For each purchase, the data include the Universal Product Code (UPC), the price paid, the amount purchased, the type of store from where it was purchased, package size and type, and product specifics (e.g., baby carrots, chunky soup, or whole-wheat bread).
The researchers looked at prices for 17 products—9 fresh and 8 processed—that consumers most commonly choose to buy organic. Premiums were measured both in terms of the actual difference in price and the relative difference—the difference in price between the organic and nonorganic prices as a percent of the nonorganic price.
Organic Spinach, Granola, and Carrots Had Lowest Price Premiums
Premiums for the 17 organic products in 2010 ranged from 7 percent (above nonorganic) for fresh spinach to 82 percent for eggs. The fresh spinach estimate includes both baby and mature spinach, while the egg estimate includes only unprocessed shell eggs.
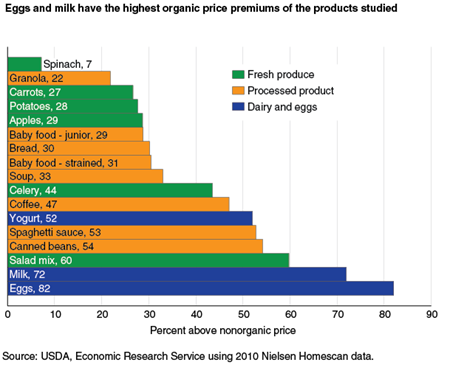
Milk and eggs had the largest relative organic price premiums. Their large premiums likely reflect high production costs because organic livestock farmers must provide their animals with organic feed and pasture; only use organic health care practices, which forbid the use of antibiotics or growth hormones; and (in the case of dairy cows) cover the cost of transitioning the herd from a conventional herd to an organic herd.
Fresh fruits and vegetables exhibited the widest spread of relative organic price premiums in 2010—from 7 percent for spinach to 60 percent for salad mix. This range likely reflects the relative differences in production costs. For example, once the field has gone through the 3-year transition from nonorganic to organic, baby spinach has very few other additional costs since the risk of insects or weed damage is low during its short growing season.
At the other end of the spectrum, organic salad mix contains several different vegetables and can contain dried fruit, meat, nuts, and dressing—all from potentially different farms and food manufacturers. The company bagging the organic salad mix must maintain its own certification, ensure that all affiliated farms are properly certified, and guarantee that the salad ingredients are not comingled with nonorganic ingredients during transport or processing.
The organic price premium for processed food ranged from 22 percent for granola to 54 percent for canned beans. Because the processed foods category contains many different products, it is difficult to generalize the reasons for the premiums. Some products, like coffee and canned beans, have only one ingredient for a manufacturer to source, while others like bread have multiple organic ingredients to procure. Some products have special demand considerations that might boost organic premiums; for example, parents may be more willing to pay for organic baby foods for the short time their babies and toddlers consume them. Finally, economies of scale can affect the cost of production. About 30 percent of granola sales in 2010 were organic, compared with just over 1 percent of bread sales.
Most Organic Products Displayed No Consistent Trend in Price Premiums
Retail food prices were susceptible to price shocks and fluctuations during 2004-10. For example, from late 2007 through 2008, food prices spiked sharply after being fairly steady for the previous few years. Price spikes are caused by both supply factors (e.g., weather, energy prices, and changes in major crop or livestock producers) and demand (e.g., food-safety scares, diet fads, and media stories on new products, food trends, or nutrition).
Organic price premiums are dependent on the prices of both organic and nonorganic foods. In some cases, price fluctuations affecting organic food may coincide with those affecting nonorganic food production—in these cases, the organic price premium may be unaffected by underlying price shocks. However, because organic and nonorganic markets are often significantly different from each other, when the nonorganic price goes up, the organic premium may go down because the shelf price for the organic product is unaffected. For example, an earlier study found that energy and advertising costs affect nonorganic food prices more than organic food prices. This may be because nonorganic agriculture is more dependent on energy-intensive inputs such as nonorganic fertilizers and pesticides. The smaller impact of advertising costs on organic foods may indicate that companies who sell organic products rely less on advertising and more on the fact that the product is organic when marketing their products.
For the most part, organic price premiums exhibited the most volatility from 2004 to 2006, when the National Organic Program was relatively new. Most of the relative premiums estimated in this study did not exhibit a clear increasing or decreasing trend. Eggs show the most dramatic changes, ranging from a relative premium of 173 percent in 2005 to 66 percent in 2008. These large fluctuations in the premium for organic eggs may be a result of the large retail price swings common for nonorganic eggs. The premium for eggs remained highest of all analyzed products throughout the study period. The high premium for both eggs and milk is likely a result of higher costs of production compared with plant-based products. Organic animals must be fed organic feed, have year-round access to the outdoors on organically certified land, and cannot be given antibiotics. If an organic dairy cow becomes sick and the farmer treats the animal with antibiotics, the farmer cannot sell the cow’s milk as organic. All of these requirements cost farmers more than following common nonorganic practices.
Organic premiums for spinach, coffee, granola, and canned beans generally decreased from 2004 to 2010. In 2004, organic spinach had one of the highest relative premiums (57 percent) but fell rapidly to 7 percent in 2010, the lowest in the study. The relative premium for canned beans and coffee started out higher than most other products (about 100 percent) and ended in the middle.
Two products—yogurt and strained baby food—started out with relative organic price premiums on the small side (26 percent for yogurt and 18 percent for strained baby food) but increased to the middle of the range. Although the main ingredient in yogurt is milk, the relative premium for yogurt remained below the relative premium for milk.
Organic Granola, Spinach, and Strained Baby Food Had Largest Market Shares in 2004-10
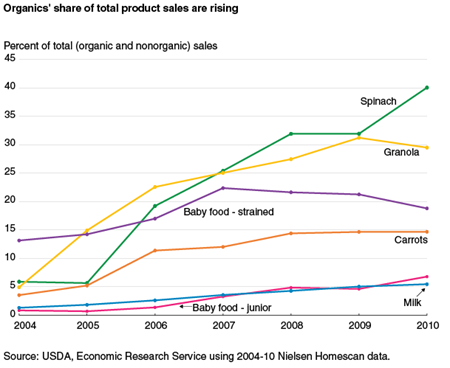
The share of organic sales for most products increased from 2004 to 2010. Organic spinach, granola, and carrots had the fastest growth, perhaps supported by declining price premiums. Organics’ share of total product sales (organic and nonorganic) was largest for spinach and granola in 2004-10. About 28 percent of the total pounds of spinach sold in retail stores in the United States in 2010 was organic, and organic spinach accounted for about 40 percent of all retail spinach sales. Similarly, organic granola sales were 25 percent of the total pounds of granola sold and 30 percent of all sales.
After granola, strained baby food and carrots had the next largest market shares in 2010. However, the market share for carrots rose consistently between 2004 and 2010, but the share for strained baby food decreased after 2007—from around 22 percent in 2007 to 18 percent in 2010. During this same time period, organic sales for junior baby food rose from under 1 percent of total junior baby food sales in 2004 to almost 7 percent in 2010—one of the fastest increases in market share of the 17 foods studied. Baby food and milk (organic milk was about 5 percent of total milk sales in 2010) are frequently fed to children, which might account for the growth in organic sales throughout the study period.
Looking Beyond 2010
Since 2010, organic sales have continued to grow and were about 5 percent of all food sales in 2014, versus 3.9 percent in 2010. Fresh fruits and vegetables accounted for about 35 percent of all organic sales in 2012. The diversity of retailers offering organic foods has continued to expand beyond initial offerings in natural food stores. In fact, most major chains stock their own line of organic products. More pre-packaged and semi-prepared organic produce items have come on the market, many of which bear a national-, regional-, or store-brand label. ERS research has shown that U.S. farmers are increasingly dependent on imported feed to meet the growing demand for organic milk and eggs. U.S. grocery store chains are increasingly relying on contracts with growers to produce organic food for their customers. Greater reliance on imported organic inputs and contracts between retailers and growers may affect the retail premiums of today’s organic foods.
The Nielsen Homescan Data
The data used for this study are from the Nielsen Homescan panel—a set of households who record the food they purchase from grocery stores, club stores, mass merchandizers, super centers, convenience stores, health food stores, and other places where they purchase groceries. Respondents do not report food they purchase from restaurants, fast food establishments, pizza places, school cafeterias, movie theaters, sports arenas, or other places where food is prepared for them.
In the early years (2004-6), there were about 40,000 households in the static panel; the panel was expanded to about 60,000 households in 2007. Nielsen defines the static panel as households who record at least 1 purchase per month in 10 of the 12 months of the year.
After 2006, households only scanned foods with a bar code—or Universal Product Code (UPC)—put on by the manufacturer or packager of the product. The scanner provided to the panel households is not able to read the store-specific bar code stickers sometimes found on individual produce items or other foods packaged by the store. For this reason, the ERS study does not include produce that is sold loose or fresh meat, poultry, or seafood, which is often packaged by the store. Bakery or deli items that do not have a manufacturer’s bar code are also not included.
The products included in this analysis are commonly sold pre-packaged. Fresh spinach, potatoes, celery, and salad mix are often sold in a bag or plastic box. The Nielsen data also show a wide range of apple varieties that are available in standard-size bags with a bar code. Carrots are almost exclusively sold in bags bearing a UPC.
Changes in Retail Organic Price Premiums from 2004 to 2010, by Andrea Carlson and Edward C. Jaenicke, USDA, Economic Research Service, May 2016
“Estimating and Investigating Organic Premiums for Retail-Level Food Products,” E.C. Jaenicke and A.C. Carlson, Agribusiness 31(4):453-471, April 2015
Emerging Issues in the U.S. Organic Industry, by Catherine Greene, Carolyn Dimitri, Biing-Hwan Lin, William D. McBride, Lydia Oberholtzer, and Travis A. Smith, USDA, Economic Research Service, June 2009
Economic Issues in the Coexistence of Organic, Genetically Engineered (GE), and Non-GE Crops, by Catherine Greene, Seth J. Wechsler, Aaron Adalja, and James Hanson, USDA, Economic Research Service, February 2016
The Profit Potential of Certified Organic Field Crop Production, by William D. McBride, Catherine Greene, Linda Foreman, and Mir Ali, USDA, Economic Research Service, July 2015