

Patterns in FDA Food Import Refusals Highlight Most Frequently Detected Problems

Highlights:
-
From 2005 to 2013, two product categories were responsible for over a third of FDA's import refusals, and the top six categories accounted for nearly 70 percent of refusals.
-
Spices, flavors, and salts’ share of all imported food refusals roughly doubled between 1998-2004 and 2005-13.
-
Among FDA-detected violations for pathogens/toxins, Salmonella accounted for 84 percent in 2005-13, up from 63 percent in 1998-2004. At the same time, the number of violations for Listeria decreased.
As part of its oversight of the safety of U.S. food products, the U.S. Food and Drug Administration (FDA) inspects imported foods at the border or port of entry for evidence of adulteration or misbranding. FDA has limited resources, and physically inspects about 1 percent of the approximately 60 million tons of food under its regulatory authority imported into the United States each year—products ranging from Spanish clementines to ground pepper and rice from India. FDA inspectors target certain firms and types of products that are prone to greater risks. When an inspector identifies an adulteration or misbranding violation, the shipment is subject to refusal into the United States.
ERS researchers analyzed the records of FDA refusals over 2005-13 to assess patterns in import refusals by product category, violation type, and exporting country and compared results with an earlier study analyzing similar data over 1998-2004. In both time periods, the top three products in terms of refusals were fishery/seafood products, vegetables/vegetable products, and fruit/fruit products. The countries with the most food shipments refused by FDA—Mexico, India, and China—have distinct sets of product categories that reflect the quantities and types of products they export to the United States.
FDA Uses a Risk-Based Inspection Protocol
FDA does not have the resources to examine every shipment of food entering the United States. Thus, FDA inspectors must prioritize and target certain exporting countries, producers, importers, commodities, or products it expects to pose greater risk to human health or to more likely be in violation of U.S. regulations. FDA uses a set of risk-based criteria to determine which shipments should be inspected. The nonrandom nature of FDA sampling means that researchers cannot draw inferences about the relative safety of food produced in various countries or the relative risk of certain food products. Instead, FDA import refusals reveal recurring patterns of import violations in food products that have repeatedly attracted the attention of FDA inspectors.
All imports refused by FDA are reported in FDA’s Operational and Administrative System for Import Support (OASIS) database. In the OASIS database, each violation is listed with a charge statement and shorthand code. Many of these charge statements explicitly list adulteration or misbranding. Foods that have been adulterated or misbranded are specifically prohibited in interstate commerce by the Federal Food, Drug, & Cosmetic Act. The Act defines an adulterated food as one that contains, for example, poisonous ingredients, disease-causing bacteria and viruses (pathogens), unsafe color additives, pesticide residues, or apparent filth.
Food is typically considered misbranded if it bears a false or misleading label with regard to ingredients, origin/manufacturer, or quality of ingredients. Many foods refused because of misbranding violations pose no imminent threat to public health, but others, like violations for undeclared allergens, do. Some violations may be economically motivated, as when producers substitute cheaper ingredients in a product and fail to label this substitution on the package. For example, producers may add maltodextrin (an inexpensive food additive made from starch) to honey. Though safe to consume, the presence of maltodextrin—if not labeled accurately—would be grounds for refusal.
Seafood and Vegetables Top the List of Import Refusals
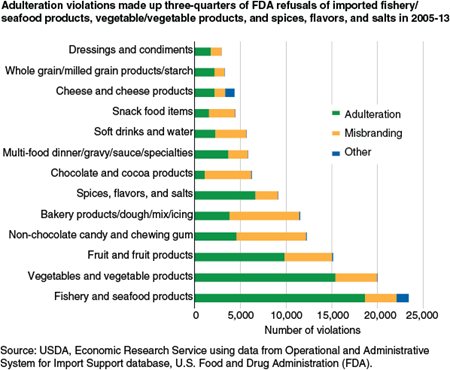
From 2005 to 2013, FDA refused the entry of 87,552 shipments of food into the United States after inspections determined that the shipments violated one or more U.S. regulations. Two product categories were responsible for more than a third of these import refusals. Fishery/seafood products accounted for 20.5 percent of all shipments refused in 2005-13, and vegetables/vegetable products accounted for 16.1 percent of refusals. Four other product categories (fruit/fruit products; spices, flavors, and salts; nonchocolate candy and chewing gum; bakery products/dough/mix/icing) each accounted for at least 5 percent of import violations. In total, the top 6 categories accounted for about 69 percent of FDA import refusals in 2005-13.
In both 1998-2004 and 2005-13, the top three product categories in violation were fishery/seafood products, vegetables/vegetable products, and fruit/fruit products. While fishery/seafood products’ share was essentially the same in 1998-2004 and 2005-13, both the vegetable and fruit product categories’ shares of import refusals declined between 1998-2004 and 2005-13. Spices, flavors, and salts’ share of import refusals, on the other hand, more than doubled—from 3.8 percent in 1998-2004 to 7.7 percent in 2005-13.

Nearly Three in Five Food Import Refusals Are Due to Adulteration
In 2005-13, adulteration accounted for 57 percent of all violations. Almost all of the remainder (41 percent) were violations for misbranding and about 2 percent were not easily categorized as either adulteration or misbranding. In 1998-2004, the share of misbranding violations was lower (33 percent) and the share of adulteration violations higher (65 percent).
The share of violations due to adulteration or misbranding varied by product category. For some categories in 2005-13—such as non-chocolate candy, bakery products/dough/mix/icing, and chocolate and cocoa products—the most common violation was for misbranding rather than adulteration. Most of these misbranding violations were for lacking a nutrition label.
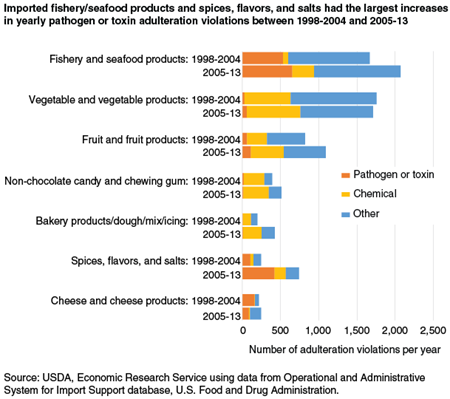
For other products, adulteration was the primary violation, in one of three forms: (1) pathogen or toxin, (2) chemical (pesticide residues, drug residues, or unsafe additives), and (3) other (including filthy or decomposed appearance and failure to register processes for canned food products). “Other” adulteration violations accounted for 50.4 percent of adulteration violations over 2005 to 2013; chemical contamination, 32.8 percent; and pathogen/toxin violations, 16.9 percent.
The most frequent violation in 2005-13, by far, in the pathogen/toxin adulteration category was for the presence of Salmonella, a genus of bacteria that can cause typhoid fever and other digestive illnesses. Salmonella violations accounted for 83.7 percent of pathogen/toxin adulteration violations, up from 63.0 percent in 1998-2004. The most Salmonella violations were in fishery and seafood products (42.0 percent of total), followed by spices, flavors, and salts (33.2 percent).
Listeria, a genus of bacteria that often results in a hospital stay and has a much-higher lethality rate than Salmonella, was the second-most common violation for pathogen/toxin adulteration in 2005-13. However, Listeria violations were down substantially from 1998-2004. Fishery and seafood products had 59.4 percent of Listeria violations, more than double the share in 1998-2004. Meanwhile, the share of Listeria violations in cheese and cheese products fell to 32.0 percent from 49.6 percent in 1998-2004.
The product category with the highest number of chemical adulteration violations per year in 2005-13 was vegetables/vegetable products. Almost three-quarters of these chemical violations were for unsafe pesticide residues, down from 90 percent in 1998-2004. Fruit/fruit products had the second-most violations per year for chemical adulteration in 2005-13. Forty-four percent of the chemical adulteration violations in fruit/fruit products were for pesticide residues, roughly the same as in the earlier period. Violations for pathogen/toxin adulteration were highest for fishery and seafood products in both 1998-2004 and 2005-13. Spices, flavors, and salts had the second largest number of pathogen/toxin violations per year in 2005-13.
Violations Differ By Exporting Country
For the three countries with the most import refusals in 2005-13—Mexico, India, and China—the most commonly refused products are correlated with the most commonly exported products to the United States. Mexico is the leading exporter of both vegetables and fruit to the United States (10.9 billion pounds of vegetables, and 7 billion pounds of fruit in 2013); India is the leading exporter of spices (161.4 million pounds in 2013); and China is the leading exporter of seafood (1.25 billion pounds in 2013).
The most frequently refused exports from Mexico were vegetables/vegetable products (30.3 percent of Mexican shipments in violation), followed by non-chocolate candy and chewing gum (19.3 percent), and fruit/fruit products (15.2 percent). FDA refusals of vegetables/vegetable products from Mexico peaked in 2005; in recent years, the number of shipments from Mexico in violation has leveled off.
Spices, flavors, and salts accounted for 29.6 percent of the violations for products shipped from India in 2005-13, followed by whole grain/milled grain products/starch (11.9 percent) and bakery products/dough/mix/icing (10.8 percent). Pesticide residues in whole grains/milled grain products/starches became a major problem in exports from India in 2012 and 2013 after years without any significant detected problems, likely due to increased detection efforts targeting that problem. Violations in spices, flavors, and salts were especially high from 2010 to 2012.
Among food imports from China, fishery/seafood product shipments led with 32.3 percent of shipments in violation, followed by vegetables/vegetable products (20.9 percent) and fruit/fruit products (10.9 percent). Over 2005-13, refused fishery/seafood product shipments from China—mostly due to veterinary drug residues—peaked in 2007. The most violations in both Chinese vegetables/vegetable products and bakery products/dough/mix/icing imports occurred in 2013.
U.S. Food Imports Continue To Grow
ERS research shows that problems with adulterated and misbranded food imports persist, despite FDA’s deterrence and detection efforts. Fishery/seafood products, vegetables/vegetable products, and fruit/fruit products were the industries with the most shipments refused in 2005-13 and also in 1998-2004. The safety of imported seafood clearly continues to be of significant concern. Spices, flavors, and salts were refused more often in 2005-13 than in 1998-2004, and pathogen and toxin adulteration was responsible for more violations in the latter period.
The same problems, year after year, in food import shipments suggest that FDA’s inspection regime may not have sufficiently deterred producers and importers from offering food shipments that violate U.S. regulations. At the same time, country-related patterns do not necessarily indicate increased problems with the safety of food products from particular countries. Violations and shipments refused by FDA reflect the outcome of a complex system that depends on import volumes and FDA’s expectations about the safety of the products offered for import.
As the total volume of imported food has risen, the number of shipments refused has declined relative to the volume of food imports. This relative decline may reflect improvements in compliance with U.S. laws among foreign producers and importers, or it may reflect FDA’s limited resources and capacity to inspect, detain, and refuse imported food. Because FDA inspections of imports are not conducted randomly, but are risk-based and designed as deterrents, additional data on the value and volume of shipments (as a share of total shipments) for various groups of producers would be needed for a careful analysis of the risks presented by specific products and producing countries.
FDA Refusals of Imported Food Products by Country and Category, 2005-2013, by John Bovay, USDA, Economic Research Service, March 2016
Food Safety and Imports: An Analysis of FDA Import Refusal Reports, by Jean C. Buzby, Laurian Unnevehr, and Donna Roberts, USDA, Economic Research Service, September 2008