

Trends in Farm Sector Debt Vary by Type of Debt and Lender

Following a period of decline due to the farm financial crisis in the 1980s, farm sector debt has trended upward since the mid-1990s but at a slower pace than growth in the 1970s. However, after multiple years of falling net farm income and tempered expectations for farm sector asset values, there is increased focus on farm debt and comparisons to the 1980s farm financial crisis. ERS’s Farm Income and Wealth Statistics data product provides detailed information on historical farm sector debt. The debt data included in the farm sector balance sheet are designed to measure year-end outstanding farm sector debt balances according to the type of loan (real or nonreal estate) and lender. The data can be used to show that the farm sector debt trends differ from those during the 1980s farm financial crisis both in terms of the magnitude and growth of farm debt, as well as the changing landscape of institutions that lend to the farm sector.
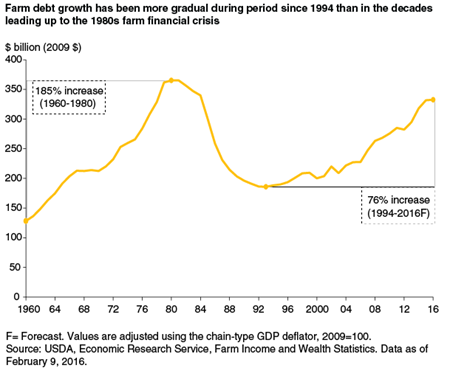
Coinciding with increasing net farm income, inflation-adjusted farm sector debt grew by 185 percent (624 percent nominally, or unadjusted for inflation) from 1960 to 1980. The historic peak in 1980 ($365 billion in inflation-adjusted dollars) coincided with high interest rates not observed since, which resulted in historically high debt servicing cost at the time. During this time period, farm sector assets grew more slowly than debt, rising only 126 percent. This led the sector’s debt-to-asset ratio higher, meaning a larger portion of asset values were financed by debt. This implies the farm sector had less ability to cover potential financial liabilities through the sale of assets, leading to a greater risk of the farm sector being able to cover debt obligations. Following the historic high in 1980, total farm sector debt then declined for 13 years before starting to increase in 1994. While farm sector debt has increased since 1994, it has grown at a slower pace than in the 1960s and 1970s. From 1994 to 2016 inflation-adjusted farm debt is expected to increase by 76 percent. As a result, total farm sector debt in 2016 is expected to remain $33 billion (9 percent) below the peak in 1980 in real (inflation-adjusted) terms. Over the 1994 to 2016 time period, farm sector assets are projected to grow by 99 percent. As a result, the farm sector’s debt-to-asset ratio reached a historic low in 2012, and has remained low by historic standards.
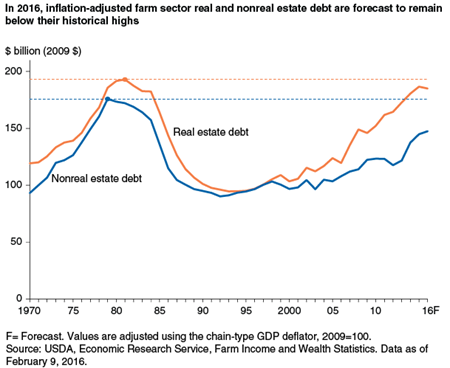
The components of farm sector debt—nonreal estate and real estate--each follow a similar trend. Nonreal estate and real estate farm sector debt peaked in 1979 and 1981, respectively, before declining through the early 1990s. However, of the two debt types, nonreal estate debt has not grown as rapidly since 1994 and, in 2016, is still $28 billion below its peak in 1979. In contrast, real estate debt has grown more rapidly and is within $8 billion of its peak in 1981.
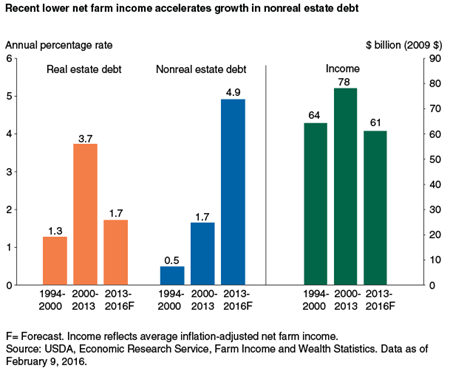
From 1994 to 2000, real estate and nonreal estate debt both grew relatively slowly. As farm income and farm real estate asset values increased from 2000 to 2013, growth in farm real estate debt accelerated, averaging 3.7 percent per year. At the same time, higher net farm income meant more cash was available for farm households to cover expenses and make investments, tempering the need for nonreal estate debt to increase as quickly. However, farm income is expected to have fallen sharply between 2014 and 2015 and is forecast down modestly in 2016. The expected drop in farm sector income through 2016 is projected to weigh on farm real estate asset values and lead to slower growth in farm real estate borrowing over this 3-year period. From 2013 to 2016, lower income is forecast to reduce farm sector liquidity, leaving less cash available to cover expenses and contributing to growth in nonreal estate debt to 4.9 percent per year on average.
Farm Sector Debt Trends Vary by Lender
ERS’s Farm Income and Wealth Statistics includes an interactive visualization that enables users to examine farm sector balance sheet data, including the composition of debt by lender. ERS forecasts total real estate and nonreal estate debt but does not forecast debt by lender. As a result, historical debt by lender data are available only through 2014. The data reveal several trends.
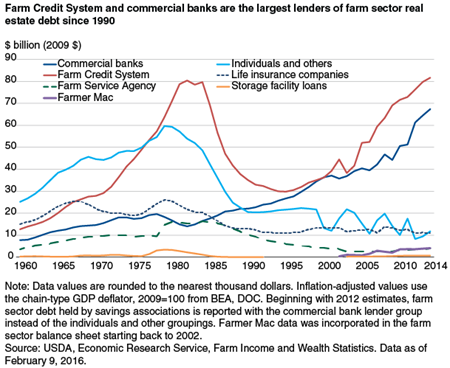
Since the late 1970s, the Farm Credit System (FCS) has been the largest U.S. lender for loans secured by real estate, and the trend in outstanding real estate debt held by FCS closely tracks the overall sector real estate debt trend. Debt held by FCS peaked in the early-1980s and then declined for the next decade before increasing to an inflation-adjusted high of $81.7 billion in 2014.
Prior to the 1990s, commercial banks held substantially less debt than the FCS. However, farm sector real estate debt held by commercial banks has increased sharply since the 1990s, leading commercial banks to become the second most prominent farm real estate lender. Farmer Mac—chartered by Congress in 1988 as a secondary market for farm real estate loans—has also shown growth in real estate debt outstanding during the period. While the real estate debt outstanding at FCS, commercial banks, and Farmer Mac has grown sharply since the 1990s, the trend has been different for the other lenders. Real estate debt outstanding at these other lenders held relatively flat or declined modestly in the period after declining during the 1980s.
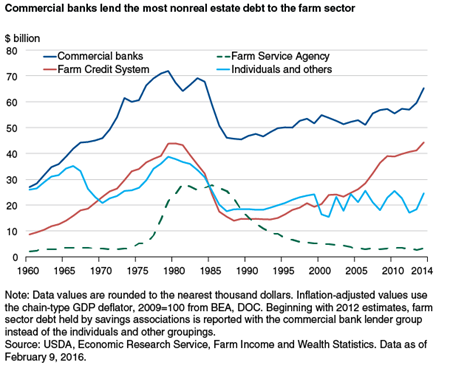
In contrast to real estate debt, commercial banks historically provided the most nonreal estate financing to the farm sector. Accordingly, the pattern for nonreal estate debt outstanding at commercial banks follows the trends for total farm nonreal estate debt, peaking in the late 1970s, before falling sharply in the 1980s farm financial crisis. The remaining farm sector nonreal estate lenders—FCS, USDA’s Farm Service Agency (FSA), and individuals and others—also experienced a similar rise and fall. However, nonreal estate debt held by commercial banks and FCS has increased since the late-1980s, while nonreal estate debt held by other lenders has been flat or declined. As a result, recent growth in total nonreal estate debt is attributable to increased lending by commercial banks and FCS.
Data on debt by lender can also be used to analyze each lender’s market share--the percentage of total farm sector debt held by lender. An examination of the data from 1994 through 2014, when total farm sector debt has generally been rising, finds that market share trends vary by lender. The market share for debt outstanding at commercial banks has held relatively steady during the period at around 40 percent of total farm debt. Over the same period, FCS institutions have increased market share from 24 percent in 1994 to 40 percent in 2014. Farmer Mac’s market share has also increased since 2002 but is still small relative to that of the other lenders.
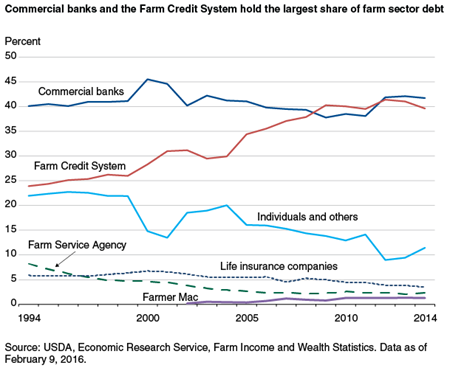
In contrast, the percentage of farm sector debt held by FSA and individuals and others has declined since 1994. However, this excludes the FSA-guaranteed loan program, for which loans are the property and responsibility of the lending institution, even though FSA may guarantee up to 95 percent of the principal and interest. The market share of life insurance companies has been relatively flat, declining only modestly. These trends confirm that commercial banks and FCS are the two largest lenders to the U.S. farm sector. Sector debt has trended upward as a whole since 1994, with the increase primarily driven by growth in loans held by commercial banks, typically the sector’s largest lender, and FCS, which has expanded its market share. Over the 1994-2014 period, the combined percentage of debt outstanding attributable to these two groups of financial institutions increased from 64 percent in 1994 to over 81 percent in 2014.
Charts and Maps of U.S. Farm Balance Sheet Data, by Farm Income Team, USDA, Economic Research Service, February 2024