

A Closer Look at Declining Fruit and Vegetable Consumption Using Linked Data Sources

Highlights:
-
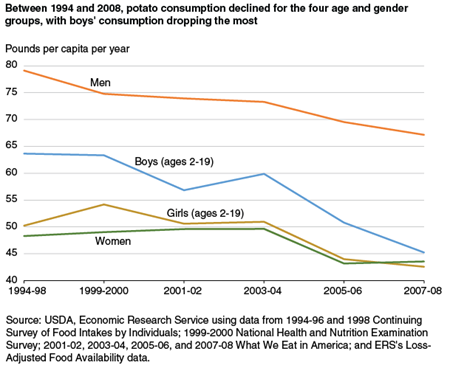
Declining consumption of potatoes was a major contributor to Americans’ lower total vegetable consumption in 2007-08, compared with 1994-98.
-
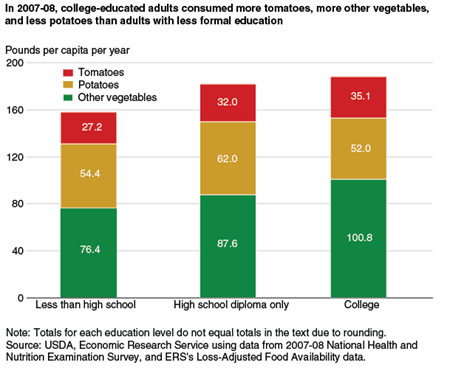
Individuals in households with higher incomes and college-educated adults consumed larger quantities of nonpotato and nontomato vegetables than those with less income and less education.
-
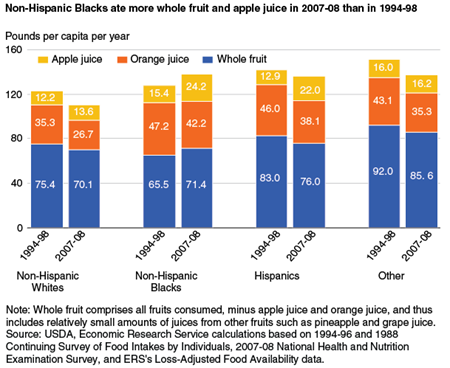
Smaller quantities of orange juice and larger quantities of apple juice were consumed in 2007-08, compared with 1994-98.
Despite Federal nutrition guidance, food industry promotional campaigns, and encouragement from parents to “Eat your vegetables,” Americans’ consumption of fruits and, especially, vegetables has declined. Over the last decade, loss-adjusted supplies of total fruits and vegetables available to consume in the United States have fallen from 299 pounds per person in 2003 to 272 pounds per person in 2013, according to ERS data. Not the direction that nutritionists and others interested in the public’s health had hoped for.
However, a deeper look into the overall numbers reveals that three fruits and vegetables—orange juice, potatoes, and head lettuce—account for 22 pounds of this 27-pound decline. And, despite the decline in consumption of some fruits and vegetables, Americans are consuming more of other types of these nutrient-packed foods.
The ERS loss-adjusted food availability data serve as a proxy for consumption by the Nation as a whole but do not reveal who eats what foods and how much is eaten by particular demographic groups. A more nuanced analysis of consumption trends—by product and by demographic groups—would identify shortfalls for particular groups and help in targeting nutrition outreach efforts.
In a recent report, ERS researchers linked ERS’s food availability data and food intake survey data, using a USDA database that translates foods into their commodity components. This linkage enabled them to break down ERS’s national consumption estimates by household and personal characteristics, helping to answer the questions: How widespread is the decline in fruit and vegetable consumption? And, is it steeper for some groups than others?
Potatoes Driving Declining Vegetable Consumption
National food intake surveys provide demographic breakdowns of who is eating what foods and how much. However, survey respondents report foods as eaten—such as a slice of apple pie, a cup of applesauce, or a glass of apple juice. A database providing the amount of apple in each food is needed to derive the total amount of apples, or other food commodities, consumed by an individual. Such a database was not available until the release of USDA’s Food Intakes Converted to Retail Commodities Database (FICRCD) (see box “USDA Databases Allow National Food Availability Estimates To Be Disaggregated by Demographics”).
ERS researchers used FICRCDs to disaggregate the thousands of mixed foods recorded in the intake surveys—from apple pie to zucchini lasagna—into 63 foods and beverages, including 11 fruits or fruit groups and 15 vegetables or vegetable groups. Per capita measures of foods and beverages eaten by people in different demographic groups were estimated by taking average consumption patterns from the surveys for different subgroups of the U.S. population and applying these patterns to the loss-adjusted food availability data for the corresponding year.
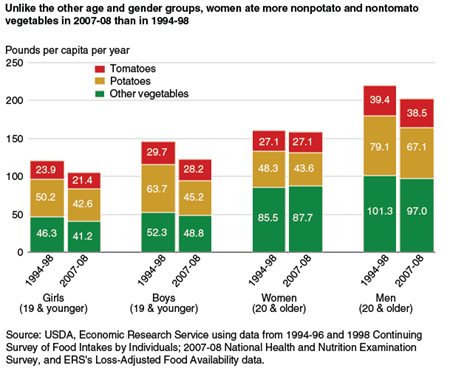
Consumption of total vegetables fell across the four age and gender groups between 1994-98 and 2007-08. Much of this decline was driven by reduced consumption of potatoes, which includes baked, mashed, french fries, chips, and other forms expressed in fresh-weight equivalents. Boys (age 2 to 19) had the largest drop; their potato consumption fell from 63.7 pounds per person per year in 1994-98 to 45.2 pounds in 2007-08. Potato consumption by non-Hispanic Whites, Hispanics, and other races fell over the period from 63.8 to 55.4, from 52.4 to 38.2, and from 50.5 to 37.1 pounds per person per year, respectively. Throughout the period, non-Hispanic Blacks consumed about 58.1 pounds of potatoes per person per year.
Intake of tomatoes—the second most consumed vegetable—held fairly steady between 1994-98 and 2007-08 for all age groups. When consumption of potatoes and tomatoes is subtracted from the mix, consumption of other vegetables by girls, boys, and men fell, too, but not as sharply as that of potatoes. For women, annual consumption of nonpotato and nontomato vegetables increased slightly (2.2 pounds per person). Some vegetables posting gains in consumption over this period in all age groups include peppers, leafy greens, and broccoli and cauliflower.
Total vegetable consumption declined between 1994 and 2008 across four race/ethnic background groups—non-Hispanic Whites, Non-Hispanic Blacks, Hispanics, and others. The decline was smallest among non-Hispanic Whites (5.5 pounds per person per year), followed by non-Hispanic Blacks (11.9 pounds), Hispanics, (23.0 pounds), and others (27.2 pounds).
Higher Income and Education Levels Mean Higher Vegetable Consumption
Data on vegetable consumption broken down by income level reveal that individuals (children and adults) in households with incomes below 185 percent of the poverty level consumed smaller quantities of potatoes and tomatoes than people in households with incomes above that level. In 2007-08, lower income individuals consumed 49.3 and 28.1 pounds per person per year of potatoes and tomatoes, respectively, and those with higher incomes consumed 53.8 pounds of potatoes and 32.1 pounds of tomatoes per person. A bigger difference was observed in consumption of other vegetables (nonpotato and nontomato): 85.8 pounds per person for higher income individuals versus 69.8 pounds per person for lower income individuals.
The more educated the adult, the more other vegetables (nonpotato and nontomato) eaten. In 2007-08, college-educated adults consumed 187.4 pounds of total vegetables per person per year, of which 100.7 pounds were other vegetables. Adults with only a high school education ate 181.9 pounds of total vegetables per person, of which 87.6 pounds were other vegetables. Adults who had less than a high school education consumed 158.2 pounds per person of all vegetables, of which 76.3 pounds were other vegetables.
Consumption Trends Consistent Across Demographic Groups for Juice...
Total fruit consumption was lower in 2007-08 than in 1994-98 for all four age and gender groups. For example, girls’ consumption of fruit declined from 131.3 pounds per person per year in 1994-98 to 121.2 pounds in 2007-08. Some of the decline in total fruit consumption was due to less orange juice being drunk by all four groups. Orange juice is the largest fruit category in terms of consumption, and average U.S. consumption fell from the equivalent of 38.3 pounds of oranges per person per year in 1994-98 to 30.9 pounds in 2007-08.
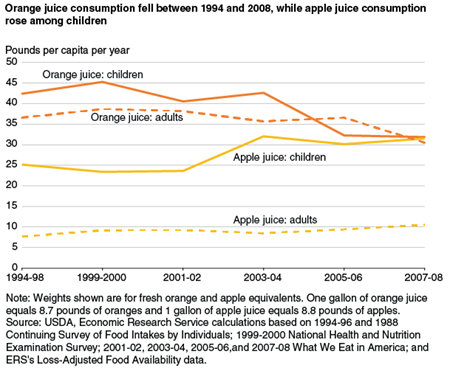
Falling orange juice consumption, however, was not the only driver of declining fruit consumption—declines were common for other fruits as well. Apple juice, berries, and grapes were the only fruits and fruit categories that had higher average U.S. consumption in 2007-08 than in 1994-98. Every demographic group examined displayed the same patterns for apple juice and orange juice consumption—larger quantities of apple juice and smaller quantities of orange juice were consumed in 2007-08 versus 1994-98.
… But Not For Whole Fruits
Trends in whole fruit consumption were not consistent across demographic groups. In this study, whole fruits comprised all categories of fruits consumed, minus orange juice and apple juice. Thus, whole fruit consumption includes a relatively small amount of juices from other fruits, such as pineapple juice and grape juice, in addition to whole fruits. Federal dietary guidance advises that at least half a person’s recommended daily intake of fruits be whole fruits.
Whole fruit consumption declined for the age and gender groups between 1994-98 and 2007-08. For example, boys’ consumption of whole fruits fell from 71.9 pounds per person per year in 1994-98 to 65.4 pounds in 2007-08. For non-college-educated adults, consumption of whole fruits was relatively stable over the period, averaging around 65 pounds per person per year; for college-educated adults, it fell from 93.7 pounds in 1994-98 to 83.2 pounds in 2007-08.
Higher income consumers’ consumption of whole fruit fell from 81.2 pounds per person per year in 1994-98 to 75.7 pounds in 2007-08, whereas lower income individuals consumed similar quantities in both periods. Non-Hispanic Whites and Hispanics’ consumption of whole fruits declined between 1994-98 and 2007-08, while non-Hispanic Blacks’ consumption in the two periods rose from 65.5 to 71.4 pounds per person per year.
Multiple Factors Affect What We Buy and Eat
ERS’s food availability and loss-adjusted food availability data show that Americans are not increasing their intake of fruits and vegetables, despite the exhortations of health and nutrition experts. Federal food intake surveys also point out lower fruit and vegetable consumption. The big question for future research is why? In some cases, one or two particular fruits and vegetables make up much of the decrease. For vegetables, U.S. potato consumption has fallen from 61.3 to 52.0 pounds per person between 1994-98 and 2007-08, with bigger relative drops for boys and no change in potato consumption for non-Hispanic Blacks. Declining orange juice consumption among all demographic groups is the largest contributor to lower fruit consumption.
Substitution among some products is also evident. Head lettuce is down, but leafy greens—such as spinach and kale—are up. Between 1994-98 and 2007-08, consumption of nonpotato and nontomato vegetables by women grew slightly from 85.5 to 87.7 pounds per person per year. For girls, boys, and men, small declines in consumption of nonpotato and nontomato vegetables occurred. Less bananas and citrus fruits are being consumed, but consumption of berries has risen over the decade. Increases in some whole fruits were not enough to offset declines in other fruits, and whole fruit consumption fell for all age and gender groups.
Food choices are complex, and a multitude of factors affect what we buy and eat. Life style changes and time constraints can determine if we sit down with a glass of orange juice for breakfast, grab a banana on the way out, or forgo the meal altogether. Time for and interest in cooking play a role, too. More eating out could mean more fries on the side or consumption of vegetables not usually prepared at home. Dietary fads and widespread popularity of ethnic cuisines can cause shifts in food choices, including for fruits and vegetables.
The price of products and the income available to buy them can also affect a person’s food choices. Smaller food budgets over time or higher prices due to supply constraints or other factors can induce one to switch to a lower priced alternative food item. Observing national trends and patterns for demographic groups is a first step in analyzing what is driving food choice and potential changes over time.
<a name='sidebar'>USDA Databases Allow National Food Availability Estimates To Be Disaggregated By Demographics</a>
ERS’s food availability data measure annual supplies of over 200 raw and semi-processed food and beverage commodities moving through the U.S. marketing system, providing per capita estimates of the types and amounts of food and beverages available for U.S. consumers to eat over time. This data series includes over 120 different types of fruits and vegetables, including fresh produce; canned, frozen, and dried products; and juices. The data are not collected from individual consumers but are instead collected from producers and distributors or estimated by Government agencies using sampling and statistical methods. The data include all food commodities—from grocery stores as well as from the away-from-home, or eating out, market.
A second ERS data series covering 1970 onward—loss-adjusted food availability—adjusts the availability amounts for losses from the farm gate to the fork, including nonedible pits and peels, damaged products, spoilage, plate waste, and other losses to more closely approximate per capita consumption. Like the food availability data, the loss-adjusted data are national estimates; they cannot be broken into demographic groups.
Using USDA’s Food Intakes Converted to Retail Commodities Databases (FICRCDs), ERS researchers linked the loss-adjusted food availability data and data from six national food intake surveys conducted from 1994-98 to 2007-08. (FIRCRCDs are currently available for 1994-2008 only.) This linking allowed the researchers to estimate each survey respondent’s total consumption of a particular fruit or vegetable; in the case of apples, for example, the total included consumption of apples as fresh fruit, juice, or as an ingredient baked in a pie. Average consumption patterns from the surveys for different subgroups of the U.S. population can then be applied to the loss-adjusted food availability data for the corresponding year, providing consumption estimates by household characteristics (income and race) and by personal characteristics (age, gender, and education level).
U.S. Food Commodity Consumption Broken Down by Demographics, 1994-2008, by Biing-Hwan Lin, Jean C. Buzby, Tobenna D. Anekwe, and Jeanine Bentley, USDA, Economic Research Service, March 2016
Commodity Consumption by Population Characteristics, by Biing-Hwan Lin, USDA, Economic Research Service, August 2019