

Schools Vary—And That Means Meal Costs Vary Too

Highlights:
-
The cost of preparing and serving school meals is influenced by where a school is located, with per-meal costs typically lower in the Southeast, Southwest, and urban areas.
-
Larger school districts have lower per-meal costs, indicating economies of scale in preparing and serving school lunches and breakfasts.
-
Efficiencies in labor and food costs are greater when the number of breakfasts more closely matches the number of lunches.
Across America, on a typical school day, more than 30 million children sit down to meals prepared and served through USDA’s National School Lunch Program (NSLP), and 13.5 million through the School Breakfast Program (SBP). All school foodservice operations that participate in these programs face the same challenge: they must prepare healthy meals that appeal to students—and they must do it on a budget. That budget is largely determined by USDA meal reimbursements, which typically are the largest single source of school foodservice revenues. But is that challenge more difficult for some school foodservice operations than others?
USDA provides meal reimbursements to local school food authorities (SFAs). An SFA is usually a unit within a school district, but it can operate on behalf of several school districts or an individual school. SFAs typically manage meal planning, purchasing of foods and other supplies, and labor decisions, all of which can affect costs. Reimbursement amounts are based on whether the student pays the full price or receives the meal for free or at a reduced price (see box, “USDA Provides Schools With Financial Support To Serve Healthy Meals”). With the exceptions of Alaska and Hawaii, meals reimbursements are set at the same rates nationwide.
SFAs are required by USDA to be nonprofit; however, school districts generally expect SFA revenues—a combination of Federal reimbursements, payments by participating students and families, revenue from nonreimbursable food sales, and other non-Federal resources—to cover their meal production costs. If reimbursement rates and other sources of SFA revenue are insufficient, SFAs may struggle to offer meals that are healthful and appealing and may have less of an incentive to promote participation in the SBP and NSLP.
At the request of Congress, in 2014, the U.S. Government Accountability Office (GAO) investigated whether school meal reimbursements should be adjusted based on locality. The GAO study found that there was insufficient evidence to draw conclusions on whether or how to adjust meal reimbursement rates given the multiple—and poorly understood—factors that affect meal costs. ERS researchers recently investigated school meal costs and found that per-meal costs were affected by several factors, most notably by an SFA’s location, its size, and the balance between the number of lunches and breakfasts it served.
Per-Meal Costs Vary By Location
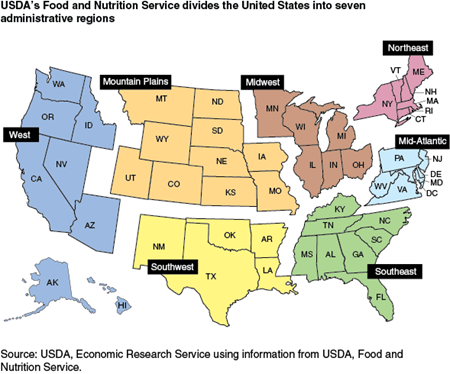
ERS researchers investigating meal cost variation used data from the 2004 School Food Authority Characteristics Survey (SFACS), which included information from a sample of more than 1,000 SFAs in the 48 contiguous States across the 7 administrative regions defined by USDA’s Food and Nutrition Service (FNS). Although the data are older, they are the only data available with adequate cost information from a sufficiently large, representative sample to examine cost variation across SFAs. The factors investigated in this analysis are still relevant, as SFAs still vary considerably in size. SFAs continue to serve far more lunches than breakfasts, although the gap has narrowed—in the 2002-03 SFACS data set, approximately one-quarter of meals served were breakfasts, whereas in fiscal 2014, breakfasts made up about one-third of meals.
Responding SFAs provided information on wages and salaries for kitchen workers, supervisors, and cooks; food costs, which include both purchased food and the value of federally provided commodities; and expenses for nonfood supplies, such as trays, napkins, and cleaning supplies, based on their spending for school year 2002-03. In their 2011 study, ERS researchers combined breakfasts and lunches to estimate costs on the basis of all meals served. For their estimation, they used an economic model, known as a cost-function model, which allowed the researchers to identify effects of particular factors, such as SFA location or size, on meal costs, while controlling for the effects of other factors.
SFAs were divided into 21 locations based on the 7 FNS regions and urbanicity—whether they were in an urban, suburban, or rural area. Results indicate that both geographic region and urbanicity influenced per-meal costs, with average per-meal costs across these 21 locations varying by up to about 20 percent. In the 2002-03 school year, per-meal costs were, on average, lowest in the Southeast and Southwest.
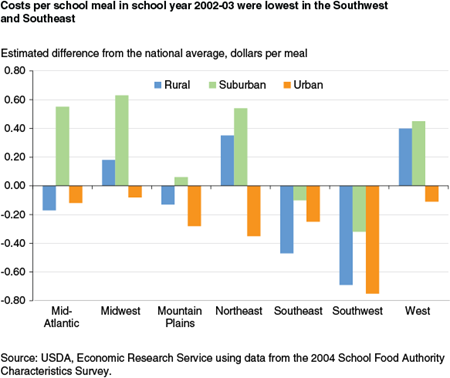
For five of the seven regions, urban SFAs had lower per-meal costs than their rural or suburban counterparts. However, other factors also influenced per-meal costs for a given SFA—its size was one factor that was particularly important.
Economies of Scale Matter, Especially for Breakfast Costs
SFAs can vary tremendously in size, from those that serve thousands of meals daily to those that serve only a few hundred. SFAs that served more meals had lower per-meal costs, indicating economies of scale. Such SFAs may be able to reduce costs via volume discounts in purchases, more efficient use of labor, or other efficiencies.
Most SFAs serve both lunches and breakfasts. Compared with lunches, school breakfasts are simpler meals and might be expected to have lower food and labor costs. In addition, SFAs might be expected to obtain efficiencies by producing both breakfasts and lunches—that is, producing two similar products might reduce the average cost of production. Combined, these attributes make it appear likely that serving breakfasts would result in lower overall per-meal costs. However, in the 2011 study, the researchers found that when breakfasts are served in the small quantities typical for SFAs in 2002-03, breakfasts were not less expensive than lunches and serving breakfast did not reduce overall per-meal costs.
The much smaller number of breakfasts served compared with lunches might explain why breakfast costs were unexpectedly high. Production systems often rely on high volumes of production to realize low costs. In a followup analysis in 2015, ERS researchers found economies of scale for both lunches and breakfasts, but they were larger for breakfasts.
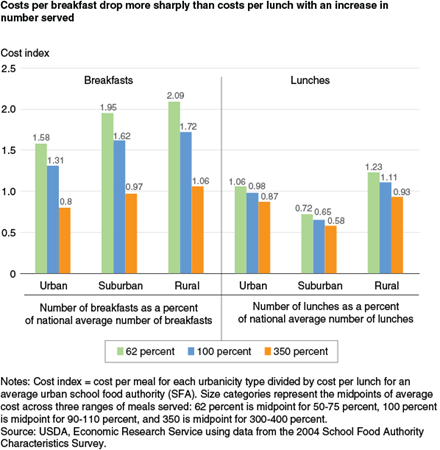
To get an idea of how size affects costs, ERS researchers created a cost index to compare the costs of breakfasts and lunches across the three urbanicity types. The index is defined as cost per meal for each urbanicity type divided by cost per lunch for an average urban SFA. The cost indices express costs relative to a reference value (cost per lunch for an average urban SFA) and make percentage comparisons easy to compute, e.g., a cost index value of 1.58 means that costs are 58 percent higher than the reference value.
Researchers used average, national prices for food and labor in all cases; only the number of meals served changed so that they could estimate cost differences due to differences in size alone. For all urbanicities, breakfast costs dropped by about 50 percent as the number of breakfasts served moved from below average (62 percent of the average size urban SFA) to above average (350 percent), e.g., the cost index fell from 2.09 to 1.06 for rural urbanicities. Lunch costs also dropped, but less—by about 20 percent over the same range of meals served, e.g., the cost index fell from 1.23 to 0.93 for rural urbanicities.
Breakfast Costs Drop When Breakfast Participation Is Closer to Lunch Participation
Another SFA characteristic that has important effects on per-meal costs is the balance between the number of breakfasts and lunches served. If substantially fewer breakfasts are served compared with lunches, there may be excess capacity, leading to higher labor and food costs. SFAs that serve a more balanced number of lunches and breakfasts are likely to have lower per-meal costs because workers are more fully occupied across the school day. Also, food may be more efficiently used when a larger share of students participate in the school’s breakfast program.
Low breakfast participation compared with lunch could arise for several reasons. Some evidence suggests that low breakfast participation is more common when breakfast is served before the start of the school day, especially if factors such as late bus arrivals limit the time that students have to eat breakfast at school. Besides lowering overall participation, such factors could make participation more variable, resulting in wasted food.
Nationwide, about 25 percent of meals served were breakfasts in school year 2002-03, but the ratio of lunches to breakfasts served varied considerably across SFAs. Among SFAs that offered both lunches and breakfasts, suburban locations served, on average, about four times more lunches than breakfasts, whereas urban locations averaged 2.5 times more lunches than breakfasts. The data also showed that suburban SFAs had much higher costs per meal than did urban SFAs, leading ERS researchers to hypothesize that excess capacity in breakfasts leads to higher breakfast costs.
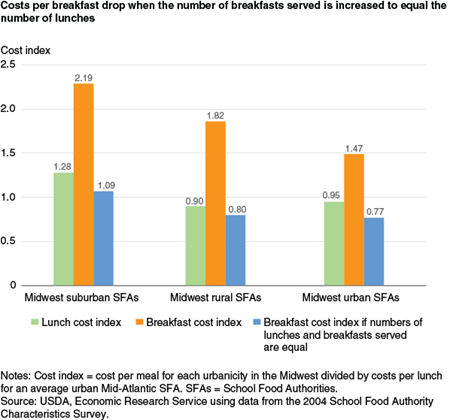
ERS researchers evaluated the costs of breakfasts relative to costs of lunches for 21 locations (7 regions, each with 3 urbanicity types). As before, they created an index to allow comparisons across locations and meal types. Researchers then estimated how the breakfast cost index would change if SFAs increased the number of breakfasts served to match the number of lunches. They kept the prices of labor and food the same, varying in only the number of breakfasts served.
Across all locations, per-breakfast costs dropped, but particularly where the lunch-breakfast ratio was unbalanced. For example, in the Midwest region, where suburban SFAs had the most unbalanced lunches-breakfasts ratio, researchers estimated that serving an equal number of lunches and breakfasts would reduce the breakfast cost index from 2.19 to 1.09 in suburban SFAs, from 1.82 to 0.80 in rural SFAs, and from 1.47 to 0.77 in urban SFAs. Similar changes were estimated in other regions.
Promoting Breakfast Participation May Decrease Per-Breakfast Costs
Since 2002-03, when the study data were collected, school breakfast participation has grown. In 2003, 8.4 million children participated in the SBP. Today, 13.5 million children participate in the SBP, 45 percent of the 30.3 million children who participate in the NSLP. ERS analyses indicate that per-breakfast costs drop substantially when breakfast participation increases and more closely matches that of lunch.
In 2010, Congress established the Community Eligibility Provision, which allows schools to offer breakfasts and lunches to all students at no cost if at least 40 percent of students live in households that receive benefits from the Supplemental Nutrition Assistance Program (SNAP) or another authorized program serving low-income households. This provision has encouraged more schools to offer breakfast and made breakfast in the classroom more feasible, since all children can participate without having to pay for the meal.
According to a USDA study of school year 2004-05, on a typical school day, 15 percent of students who did not participate in the SBP skipped breakfast—more at the middle and high school levels. Improving school breakfast participation is a part of Federal objectives ensuring that children start the school day healthy and ready to learn. Many schools are experimenting with innovative approaches such as breakfast in the classroom, “grab’n’go” breakfasts, and “second-chance breakfasts” served later in the morning for sleepy high schoolers.
Such options may expand breakfast participation and reduce per-breakfast costs, while also encouraging more students to start the day with breakfast. As school meals continue to evolve to serve today’s children, updated data on cost factors and meal quality could help improve understanding of how cost variation affects SFAs’ ability to serve healthy, appealing meals to the Nation’s school children.
<a name='sidebar1'>USDA Provides Schools With Financial Support To Serve Healthy Meals</a>
The National School Lunch Program (NSLP) and School Breakfast Program (SBP) reimburse school food authorities (SFAs) for providing school meals that meet USDA nutritional standards. USDA reimburses SFAs for the meals they serve on a sliding scale, based on whether the meals are served to students at the full (paid) price, at a reduced price, or for free. Students may be certified to receive school meals for free if their household's income is below 130 percent of the poverty level, or for a reduced price of no more than 40 cents for lunch and 30 cents for breakfast if their household’s income is between 130 and 185 percent of poverty. In fiscal 2014, 72 percent of lunches and 85 percent of breakfasts were provided free or at a reduced price.
SFAs set paid meal prices for meals served to students not from low-income households. In 2010, Congress required that the average revenue per paid meal equal the free reimbursement rate minus the paid reimbursement rate. If paid meal prices are below the required level, SFAs can gradually raise prices to meet the requirement. Alternatively, this could be achieved via additional funding from State or local governments, or through other non-Federal sources.
Reimbursement rates are updated every year based on the national average Consumer Price Index for all Urban Consumers for Food Away From Home. Beginning in fall 2012, schools began serving meals that met updated nutrition standards that featured more fruit, whole grains, and a healthier mix of vegetables. USDA provides a 6-cent bonus for every lunch served that meets these updated nutrition standards. There is also a small additional payment for schools in which a certain percentage of children receive free or reduced-price meals. Otherwise, reimbursement rates are the same for all SFAs, except those in Alaska or Hawaii, where reimbursements rates are higher.
| Less than 60 percent of lunches served free or reduced-price in school year 2013-14* | 60 percent or more of lunches served free or reduced-price in school year 2013-14* | |
|---|---|---|
| Lunch (dollars per meal) | ||
| Paid | 0.29 (0.35) | 0.31 (0.37) |
| Reduced-price | 2.67 (2.73) | 2.69 (2.75) |
| Free | 3.07 (3.13) | 3.09 (3.15) |
| Breakfast (dollars per meal) | Nonsevere need1 | Severe need1 |
| Paid | 0.29 | 0.29 |
| Reduced-price | 1.36 | 1.69 |
| Free | 1.66 | 1.99 |
| *With 6-cent bonus 1Severe need is defined as a school in which 40 percent or more of lunches are served at free or reduced price in school year 2013-14. Source: USDA, Economic Research Service using information from USDA, Food and Nutrition Service. |
||
In addition to cash payments, USDA provides USDA-purchased foods that can be used to augment purchased foods. In school year 2015-16, SFAs received foods at a value of approximately $0.24 per lunch served. SFAs can also get “bonus” USDA foods when they are available through USDA’s price support and surplus removal programs.
Economies of Scale, the Lunch-Breakfast Ratio, and the Cost of USDA School Breakfasts and Lunches, by Michael Ollinger and Joanne Guthrie, USDA, Economic Research Service, November 2015
School Foodservice Costs: Location Matters, by Michael Ollinger, Katherine Ralston, and Joanne Guthrie, USDA, Economic Research Service, May 2011
School Meals in Transition, by Katherine Ralston and Constance Newman, USDA, Economic Research Service, August 2015