


From Data to Analysis: How ERS Adds Value to the Numbers
ERS economists draw upon many different data sources and collaborate with other Agencies in the Federal Government to produce their research reports and other products. But, they also go well beyond the data, adding their expert knowledge to analyze and interpret the information and determine their conclusions. Policymakers and industry leaders alike depend on ERS expertise and objectivity to enhance their decision making.
Below is a selection of just a few examples of how ERS’s analysis work is critical in helping inform policy decisions.
Commodity Markets
ERS’s forecasting (outlook) and research programs are strongly intertwined. Long-term research at ERS produces critical information that helps shape our knowledge of markets, how they operate, and how they are changing.
ERS’s Commodity Outlook Program provides information on key issues facing policymakers, farmers, and industry. ERS conducts market analysis and provides short- and long-term projections of U.S. and world agricultural production, consumption, and trade. The program has enhanced the quality, transparency, and accessibility of data and analytical information. ERS analysts combine data from this program with data collected by different Federal and international statistical agencies, to facilitate analyses of economic performance over time, and across domestic and foreign markets.
ERS analysts—as well as those from other agencies—have an important role in conducting research and analyses that help shape the USDA’s monthly World Agricultural Supply and Demand Estimates (WASDE) forecasts for major grains, soybeans, and livestock. WASDE forecasts are used as benchmarks in the marketplace because of their comprehensive nature, objectivity, and timeliness. ERS analysts also develop supply, demand, and price forecasts for commodities not included in the WASDE projections (fruits and vegetables) in coordination with the World Agricultural Outlook Board (WAOB).
In addition, ERS works with the Farm Service Agency; the Foreign Agricultural Service; the Office of the Chief Economist; the Office of Budget and Program Analysis; the Risk Management Agency; the Agricultural Marketing Service; the Natural Resources Conservation Service; and the National Institute of Food and Agriculture to develop the USDA’s annual 10-year Agricultural Baseline Projections.
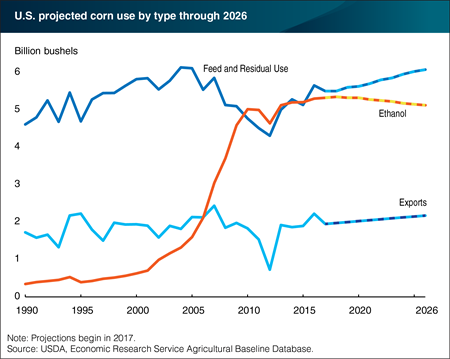
Source: USDA Agricultural Projections to 2026
ERS also uses this commodity supply and use data to inform ERS’s Food Price Outlook, a 12-18 month forecast of the Consumer Price Index (CPI) and Producer Price Index (PPI) for food. Researchers and policy analysts rely on them to anticipate changes that may be necessary in the structure, size, or regulations of various food assistance programs. Professionals working throughout the food industry use ERS’s forecasts to project costs, expenditures, or demand for their products and services.
In addition, ERS combines commodity supply and use data with USDA's annual Agricultural Resource Management Survey (ARMS) and information provided by USDA’s National Agricultural Statistics Service (NASS), Farm Service Agency (FSA), Risk Management Agency (RMA), and other sources of sector-level information, to estimate and forecast Farm Income and Wealth Statistics.
ERS also uses commodity supply and use data to track the supply of food available for consumption in the United States. ERS's Food Availability Data provides a proxy for U.S. food consumption. It has more than 200 common food categories, including grains, dairy products, meats, eggs, sweeteners, peanuts and tree nuts, coffee, tea, and cocoa, spices, vegetables and fruits. It provides time-series data for many items back to 1909.
ERS combines Food Availability Data with the dietary intake surveys conducted by USDA’s Agricultural Research Service (ARS) in collaboration with the U.S. Department of Health and Human Services’ National Center for Health Statistics (NCHS) to examine consumer food preferences by consumers’ age, income, region, race/ethnicity, and place where food is obtained, as well as by food/commodity categories and other characteristics (Commodity Consumption by Population Characteristics). This provides a comprehensive picture of the Nation’s eating habits.
Farm Economy
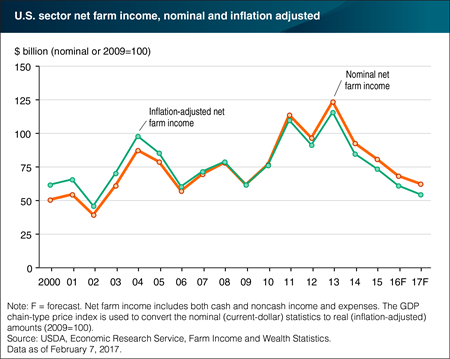
ERS economists combine commodity market data with data from the USDA's annual Agricultural Resource Management Survey (ARMS) and information provided by USDA’s National Agricultural Statistics Service (NASS), Farm Service Agency (FSA), Risk Management Agency (RMA), and other sources to estimate and forecast U.S. and State-level Farm Income and Wealth Statistics, measuring the overall financial performance of the farm sector. ERS also uses ARMS data to compile several measures of the economic well-being of farm households and to examine the changing structure and characteristics of U.S. farms.
ARMS is USDA's primary source of information on the financial condition, production practices, and resource use of America's farm businesses and the economic well-being of America's farm households. It is conducted by the National Agricultural Statistics Service (NASS) in collaboration with ERS.
ARMS data support official statistics and policy-relevant economic research regarding farm financial performance, farm household well-being, farm structure, and conservation/environmental programs. In turn, the statistics and research produced by ERS inform public and private decision makers weighing alternative policies and programs affecting the farm sector, farm families, and the environment.
ERS economists take the Information collected from ARMS and, adding their expertise, produce research reports like America’s Diverse Family Farms, as well as data sources for analysis like Commodity Costs and Returns, Farm Household Income and Characteristics, Farm Financial and Crop Production Practices, and Farm Income and Wealth Statistics released three times each year.
ARMS data also provide the foundation for official USDA estimates of the income, assets, and debt of the farm sector, farm businesses, and farm households. The Commerce Department’s Bureau of Economic Analysis (BEA), in turn, includes estimates of net farm income in its annual estimates of gross domestic product and personal income and in the development of State and local area personal income estimates.
ARMS price and expenditure data are also incorporated into USDA estimates of agricultural productivity. The rise in agricultural productivity, arising from innovation and changes in technology, has long been chronicled as the single most important source of economic growth in the U.S. farm sector. ERS data, research, and analyses quantify productivity improvements, the sources of improvement, and investigate the role of the public and private sectors in fostering U.S. agricultural productivity growth through research, education, infrastructure, and technological advances.
Food Access and Nutrition
In 2005, ERS established the Consumer Data and Information Program (CDIP) program to improve the food data infrastructure for food and nutrition policy. Enhancement to nutrition information component of the system resulted in renaming the program to Consumer Data and Nutrition Research (CDNR) in 2014. The CDNR program integrates public data (such as the USDA nutrition data and state food assistance administrative records) and proprietary information into detailed consumer and retail food purchase and sales data. The program supports the research on key concurrent and anticipated food issues and policies facing the nation.
One part of the program is a partnership with the National Center for Health Statistics (NCHS) to design the Flexible Consumer Behavior Survey (FCBS). Since 2007, ERS has fielded several rounds of the module on a variety of topics to better understand the drivers of food consumer choice behavior, such as the role of dietary and nutrition knowledge, and consumer attitudes. The FCBS is a supplement to NCHS's National Health and Nutrition Examination Survey (NHANES).
To fill a critical data gap in support of research that informs evidence-based policymaking on key national priorities, including health and obesity, hunger, and nutrition assistance policy, ERS and the Food and Nutrition Service (FNS) partnered in establishing the National Household Food Acquisition and Purchase Survey (FoodAPS). The survey captures nationally representative data on details (price, quantities, and nutrients) of household food purchases and acquisitions, along with information on factors determining the observed food acquisitions.
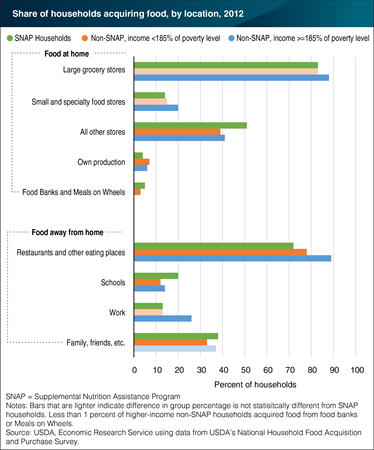
FoodAPS collects details for all food items acquired from all sources, including grocery stores, restaurants, workplaces and schools as well as data on food acquired free of charge (e.g., food banks, friends). The nearly 5,000 sampled households include low-income households and participants in the Supplemental Nutrition Assistance Program (SNAP), making the data particularly valuable to policy makers and program managers. In addition, FoodAPS links food acquisitions with detailed information about the local food environment (e.g., number of food stores near respondents’ locations) and nutrients in the food acquired by the respondents over a seven-day period. Finally, FoodAPS links to state food assistance administrative records for sampling purposes and for improving data accuracy and quality.
The restricted data, maintained on the University of Chicago’s secure NORC Data Enclave, support 168 users across 61 projects – including 25 competitively awarded grants by the National Bureau of Economic Research and the University of Kentucky’s Center for Poverty Research. In 2016, ERS posted a public-use version of the restricted data on its website to make it widely available to the public.
ERS economists are using this new data combined with existing data from ERS’s Food Access Research Atlas and Food Environment Atlas to better understand how American households acquire food, particularly those with low incomes and low access. Early analysis of the data has led to reports like Where Households Get Food in a Typical Week: Findings from USDA’s FoodAPS and Comparing National Food Acquisition and Purchase Survey (FoodAPS) Data With Other National Food Surveys’ Data. This information and analysis provides policymakers the basis for an evidence-based approach to design, implement, evaluate, and improve food assistance and nutrition programs and policies.
Linking Administrative Records to Survey Data: Enhancing Policy-Relevant Analyses of Government Programs
To harness the power of administrative data, ERS developed the Next-Generation Data Platform in partnership with USDA’s Food and Nutrition Service (FNS) and the U.S. Census Bureau. The platform links USDA administrative data from state SNAP records to Census Bureau survey data to determine who participates in USDA food assistance programs, how program participation affects the lives of those individuals, and who does not participate and why.
Administrative data contain complete and reliable information about who participates in a program, how long he or she participated, and the amount of benefits received. In addition, because administrative data have already been collected to operate the program, a re-use of the data for statistical purposes does not incur the cost of launching a new survey to collect comparable data. Linking administrative data with data from large, nationally representative Federal surveys leverages the strengths of the two data sources, gaining results that could not be obtained using either source separately.
Administrative data has been used to estimate State-level SNAP access rates among households eligible for SNAP benefits (helping SNAP administrators to better target outreach) and to assess how well SNAP is targeted to low-income households. These recent ERS studies demonstrate how this linked data can be used to illuminate SNAP performance issues, such as effectiveness in reaching those most in need: